Built for a Complete Trading Workflow
Timeless Charts extends MetaTrader 5 (MT5) with tools for every stage of the trading workflow. Build custom charts, analyze the market with order flow tools, indicators, and drawing tools, place orders with a trade panel, manage positions from the chart, practice with market replay and paper trading, and review your results through trade performance analytics.
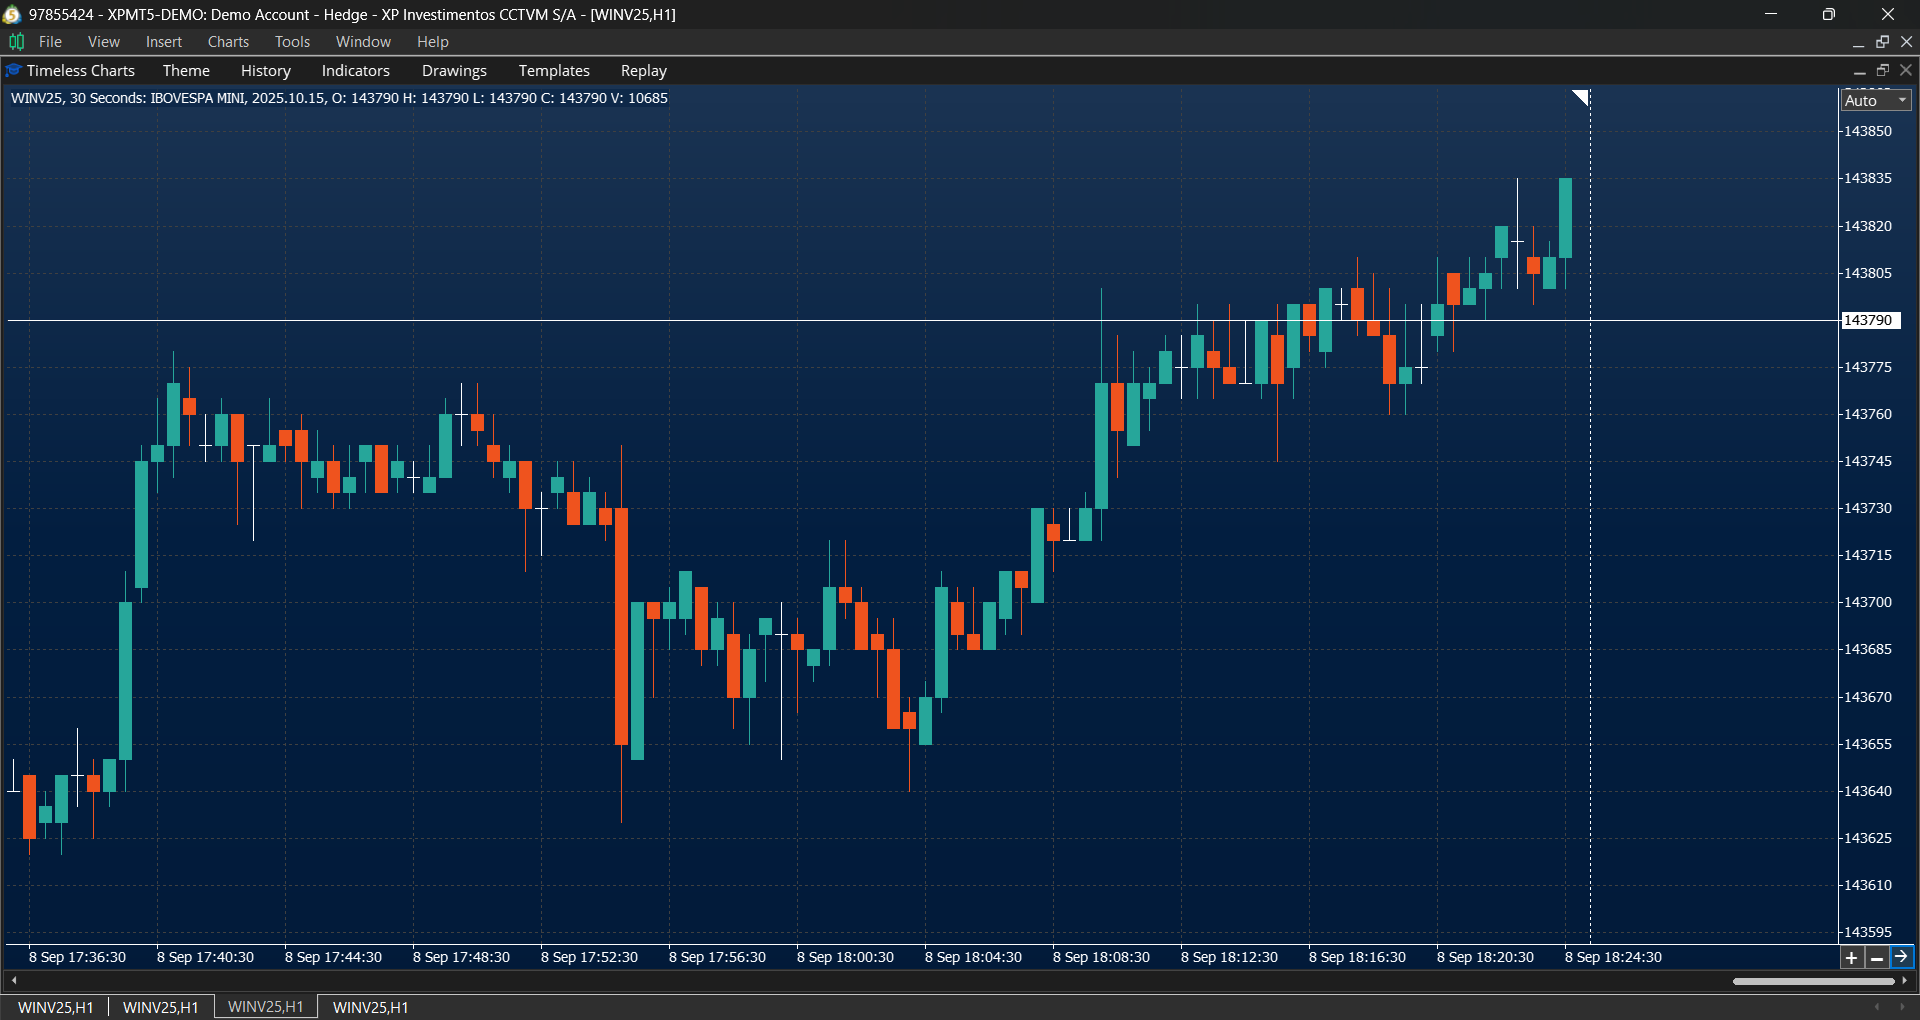
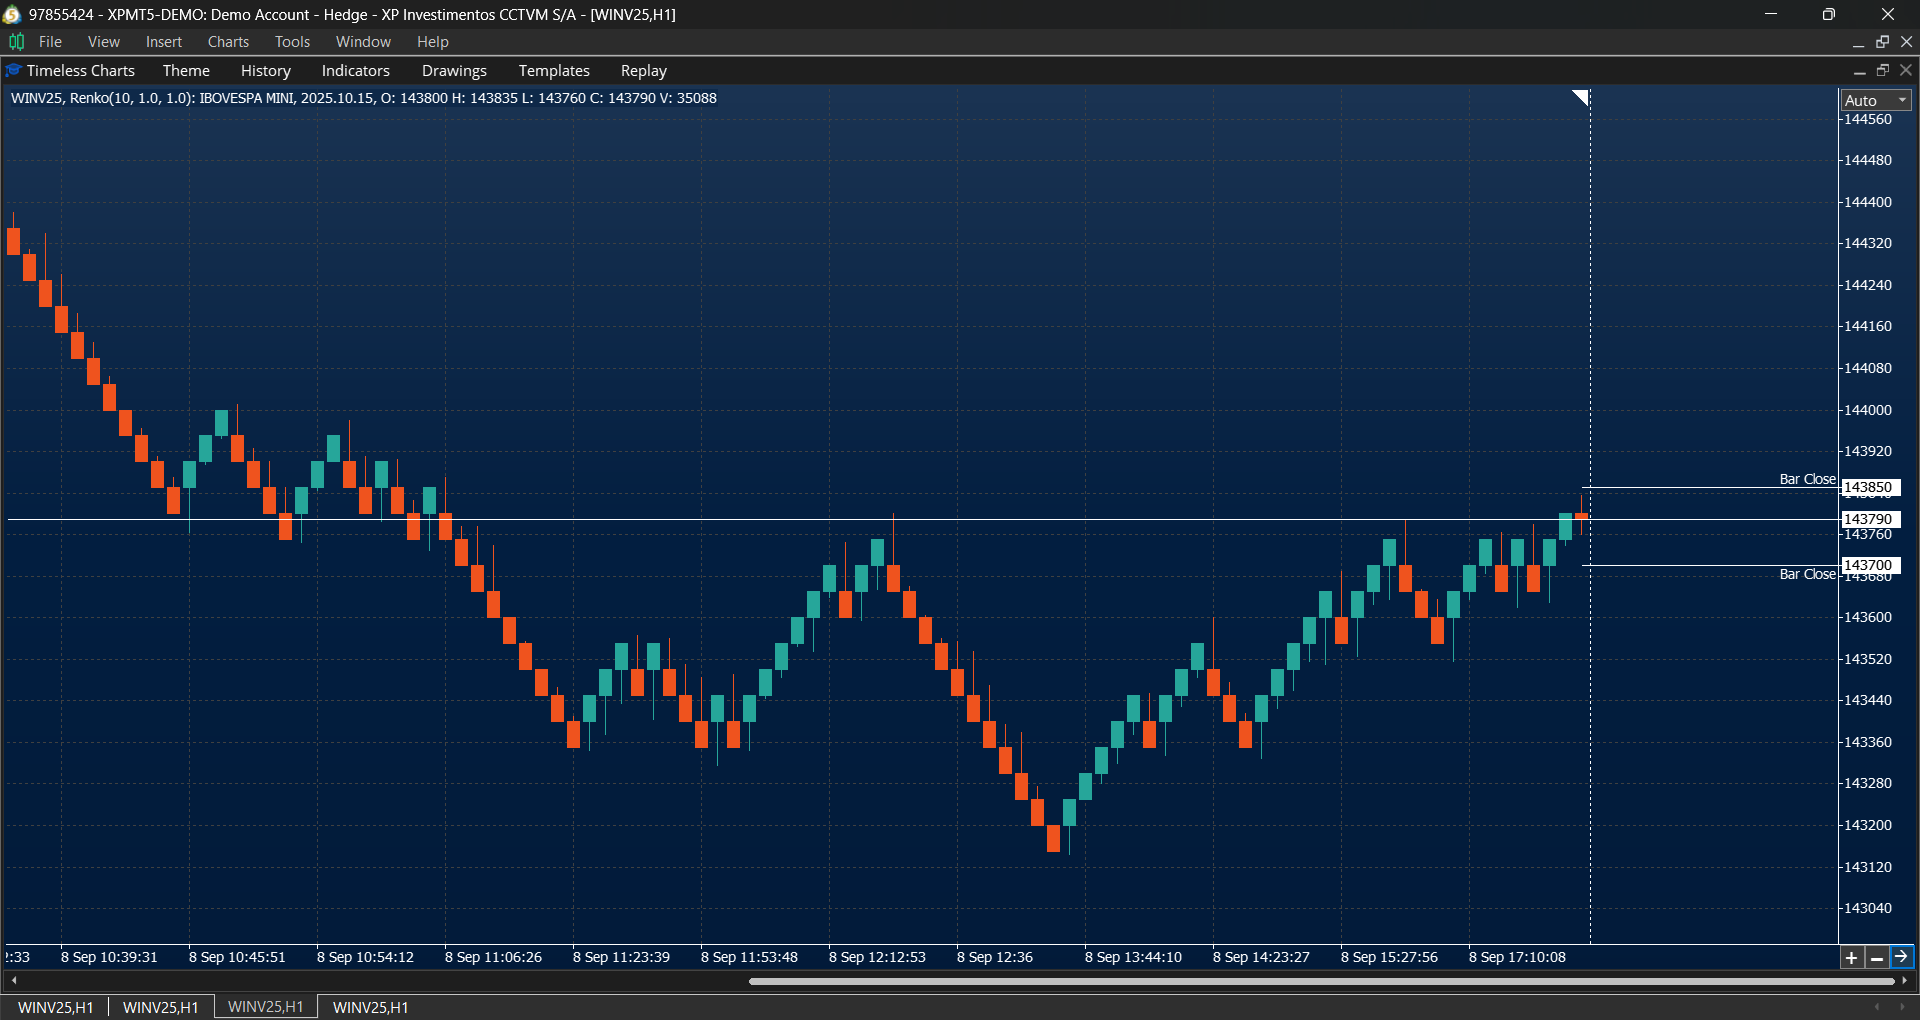
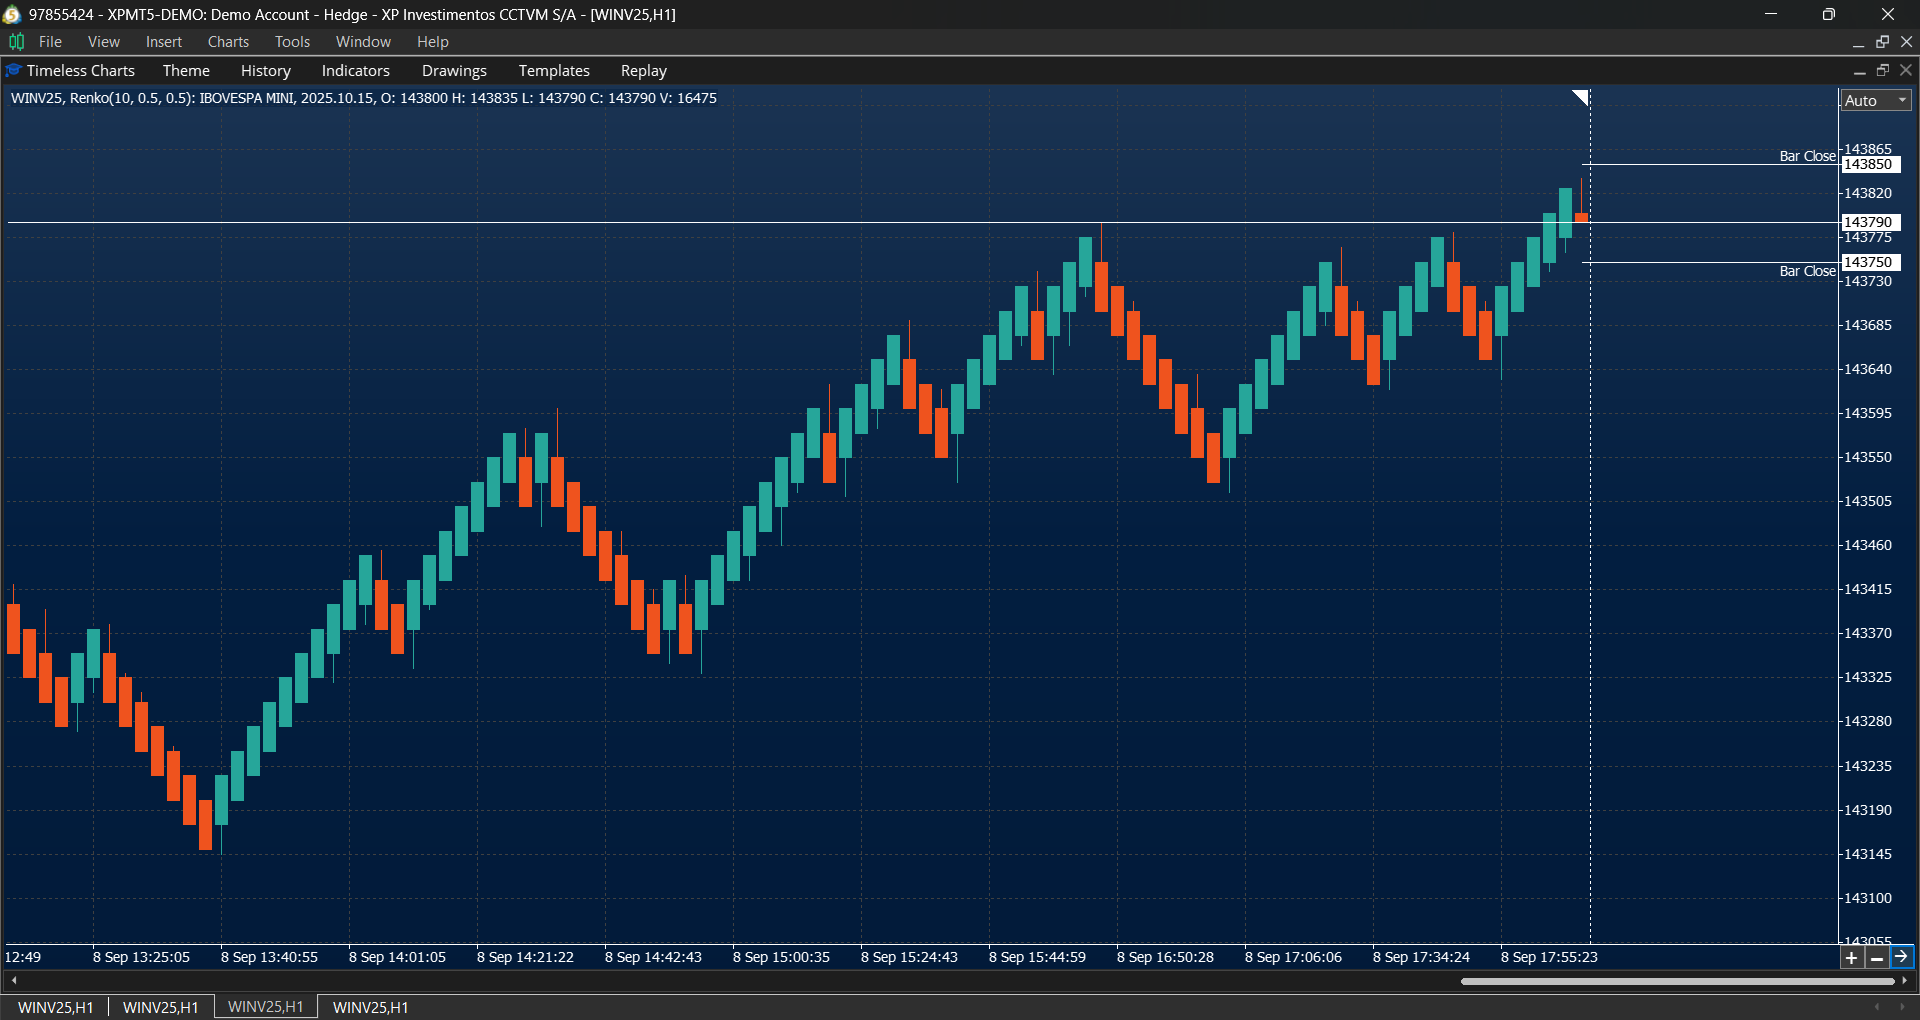
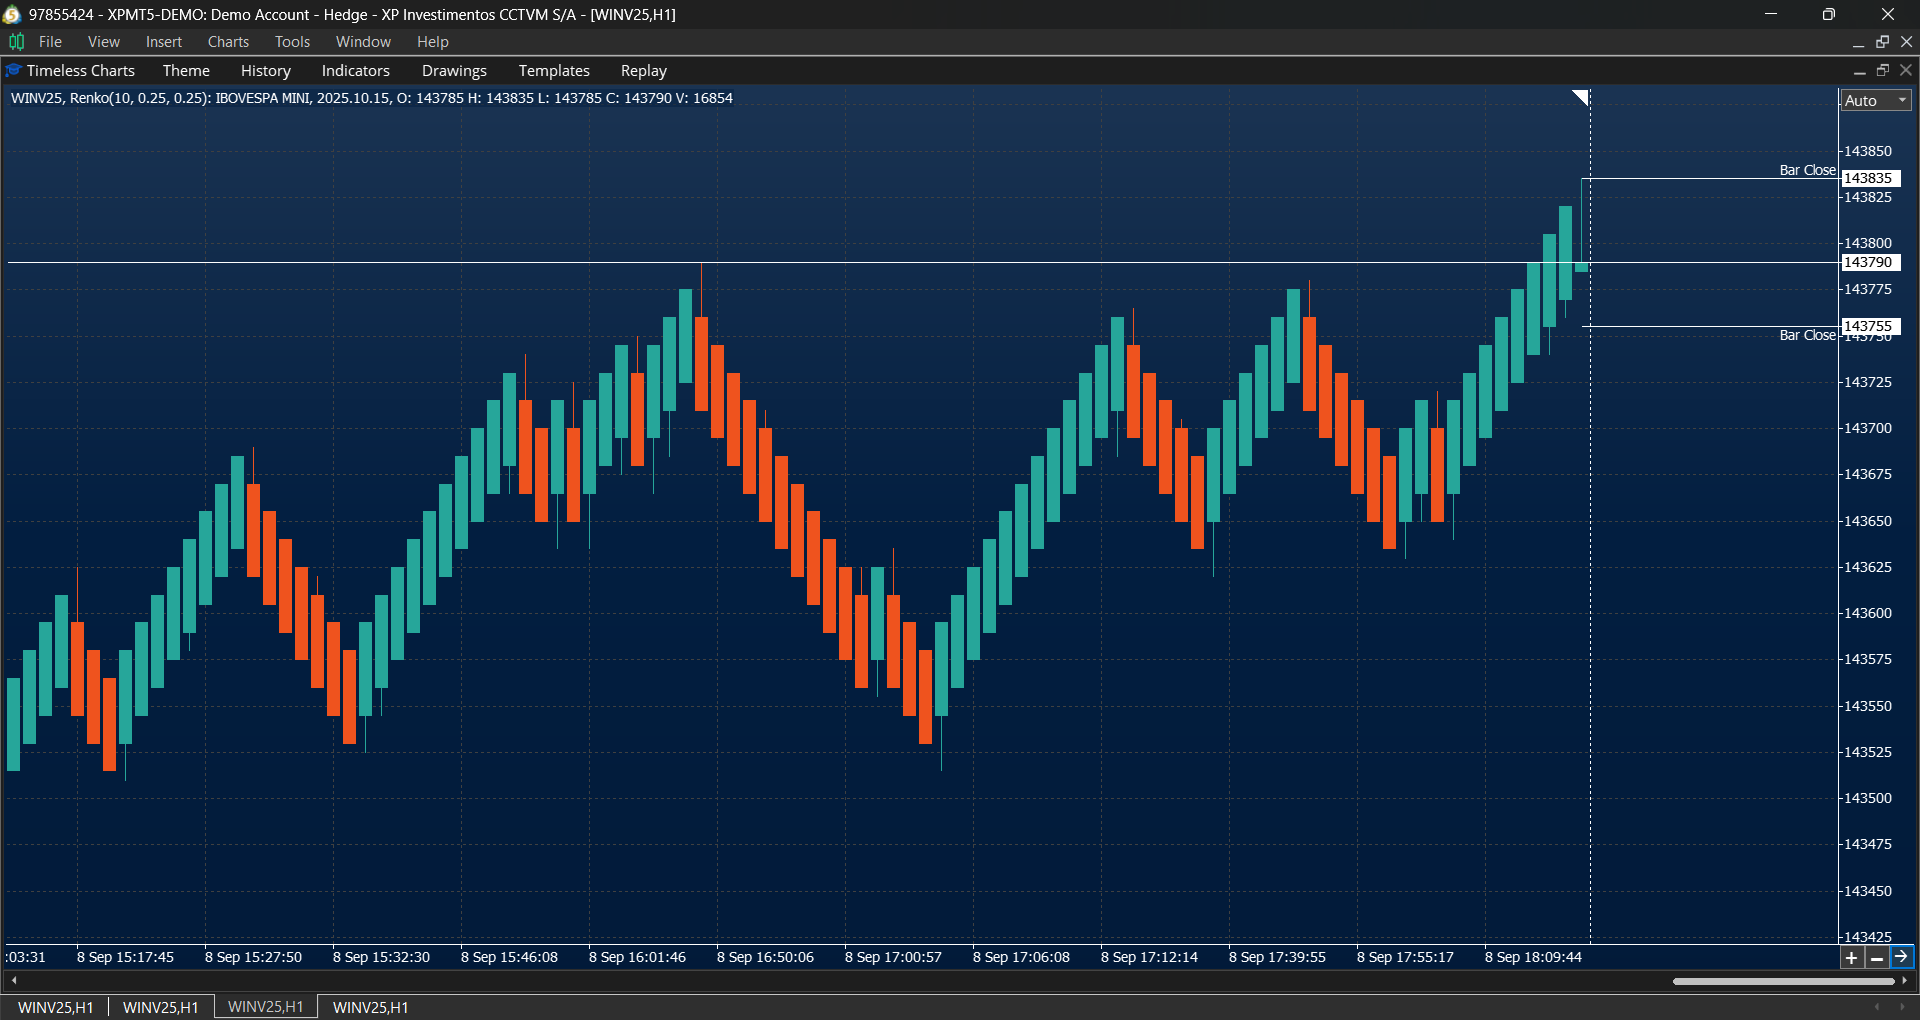
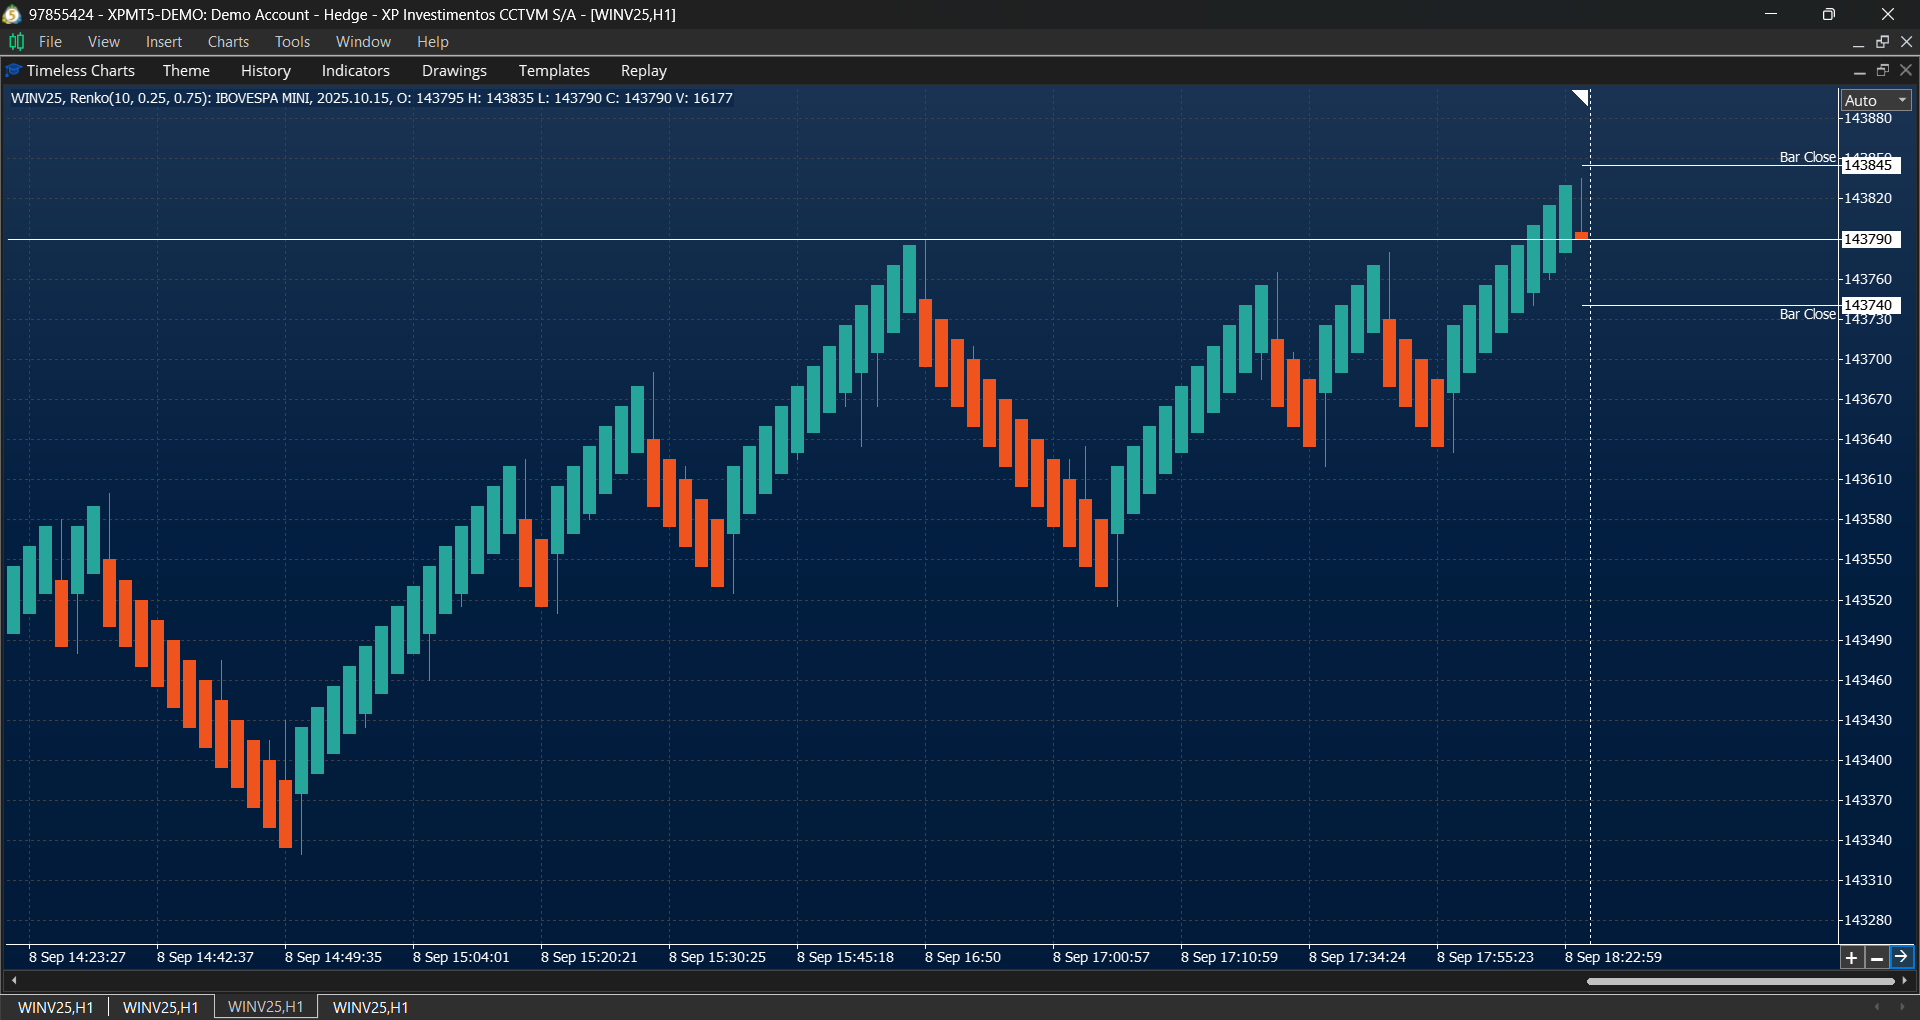
Custom Chart Types & Bar Aggregations
Reveal market structure that traditional time-based charts often hide with custom chart types and bar aggregations designed for different trading styles and market conditions.
- Custom timeframes using Seconds, Minutes, Hours, and Days.
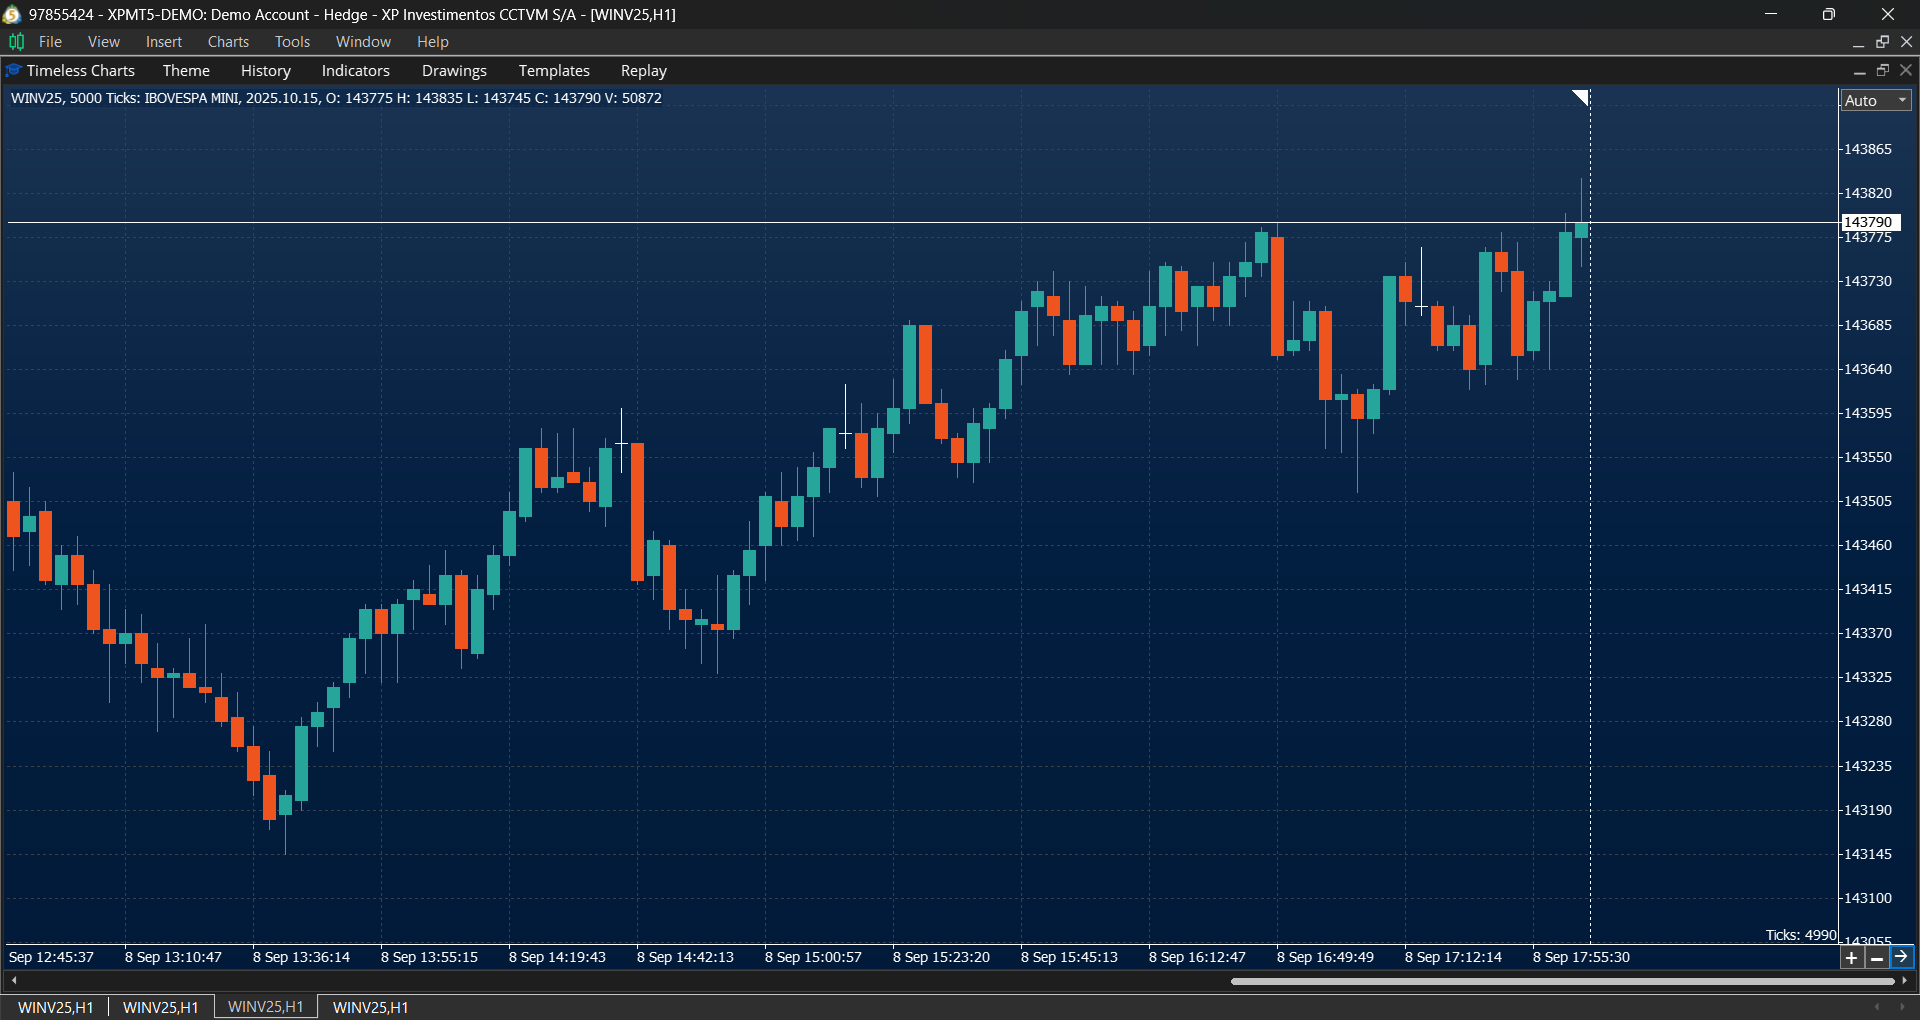
- Activity-based charts including Tick Charts and Volume Charts.
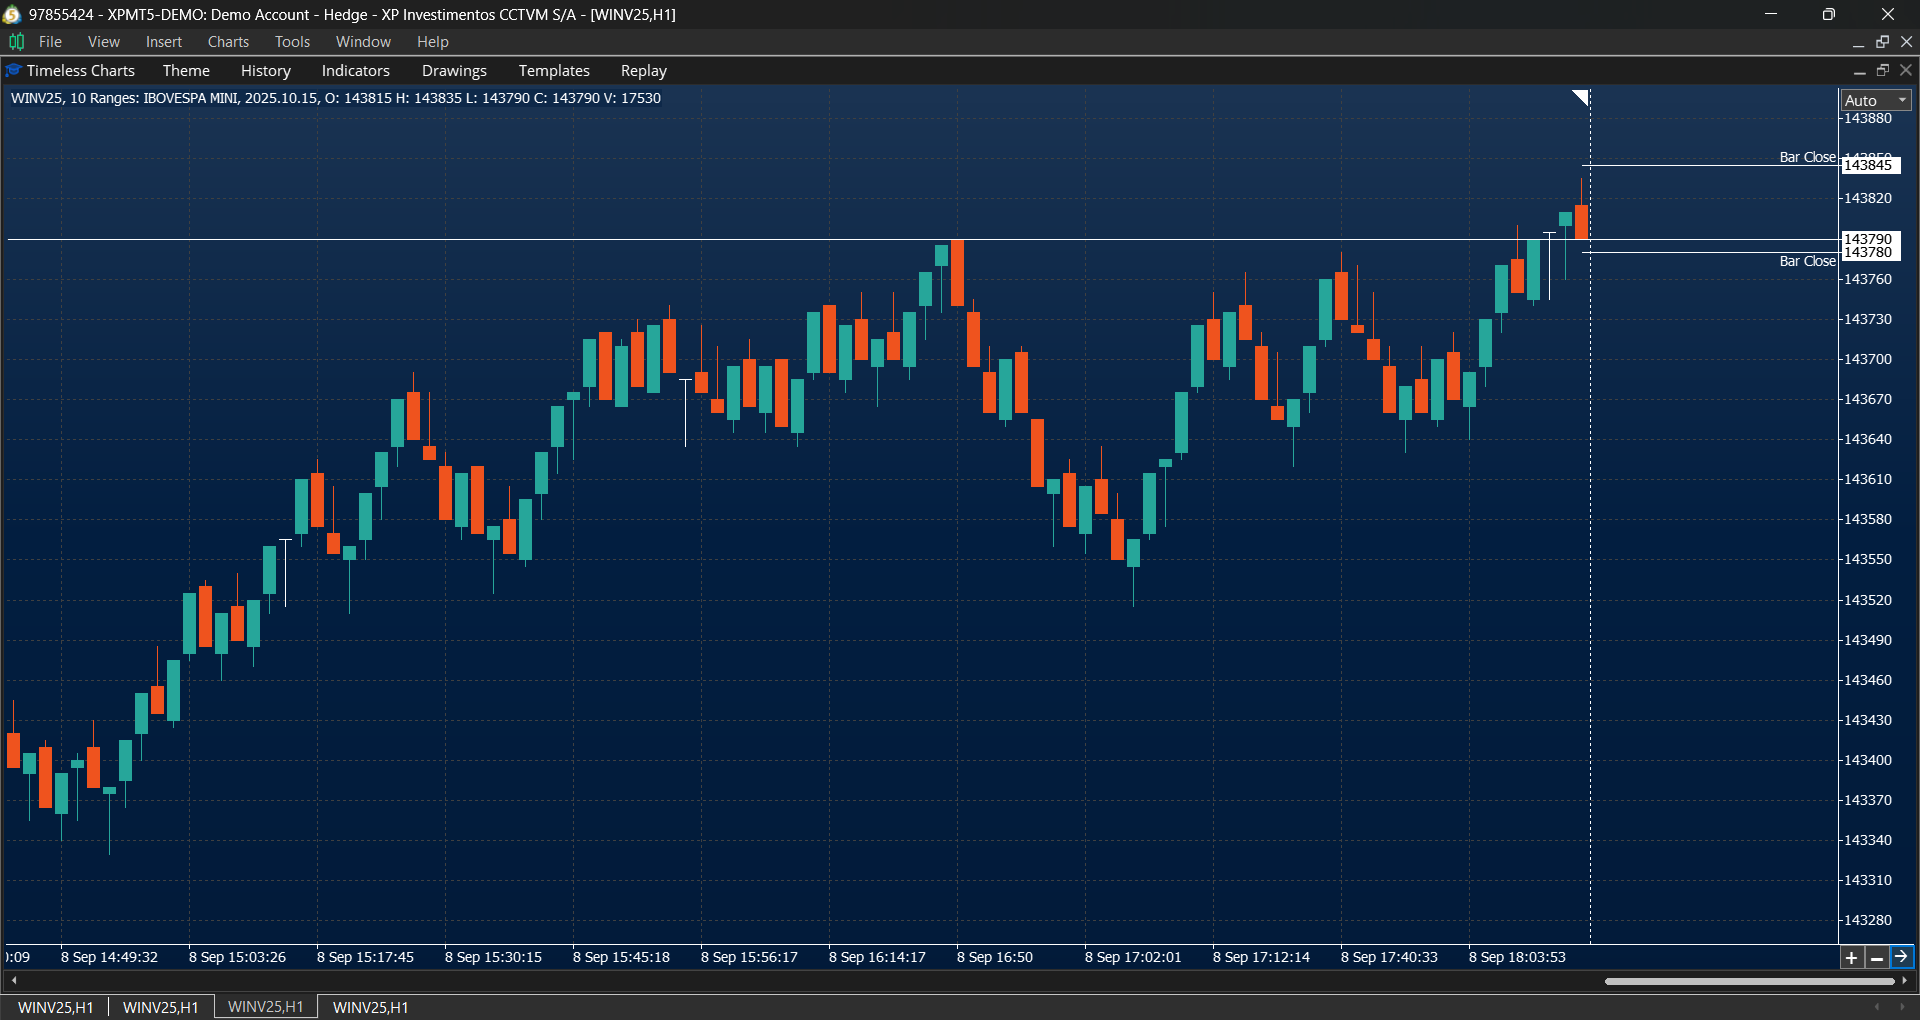
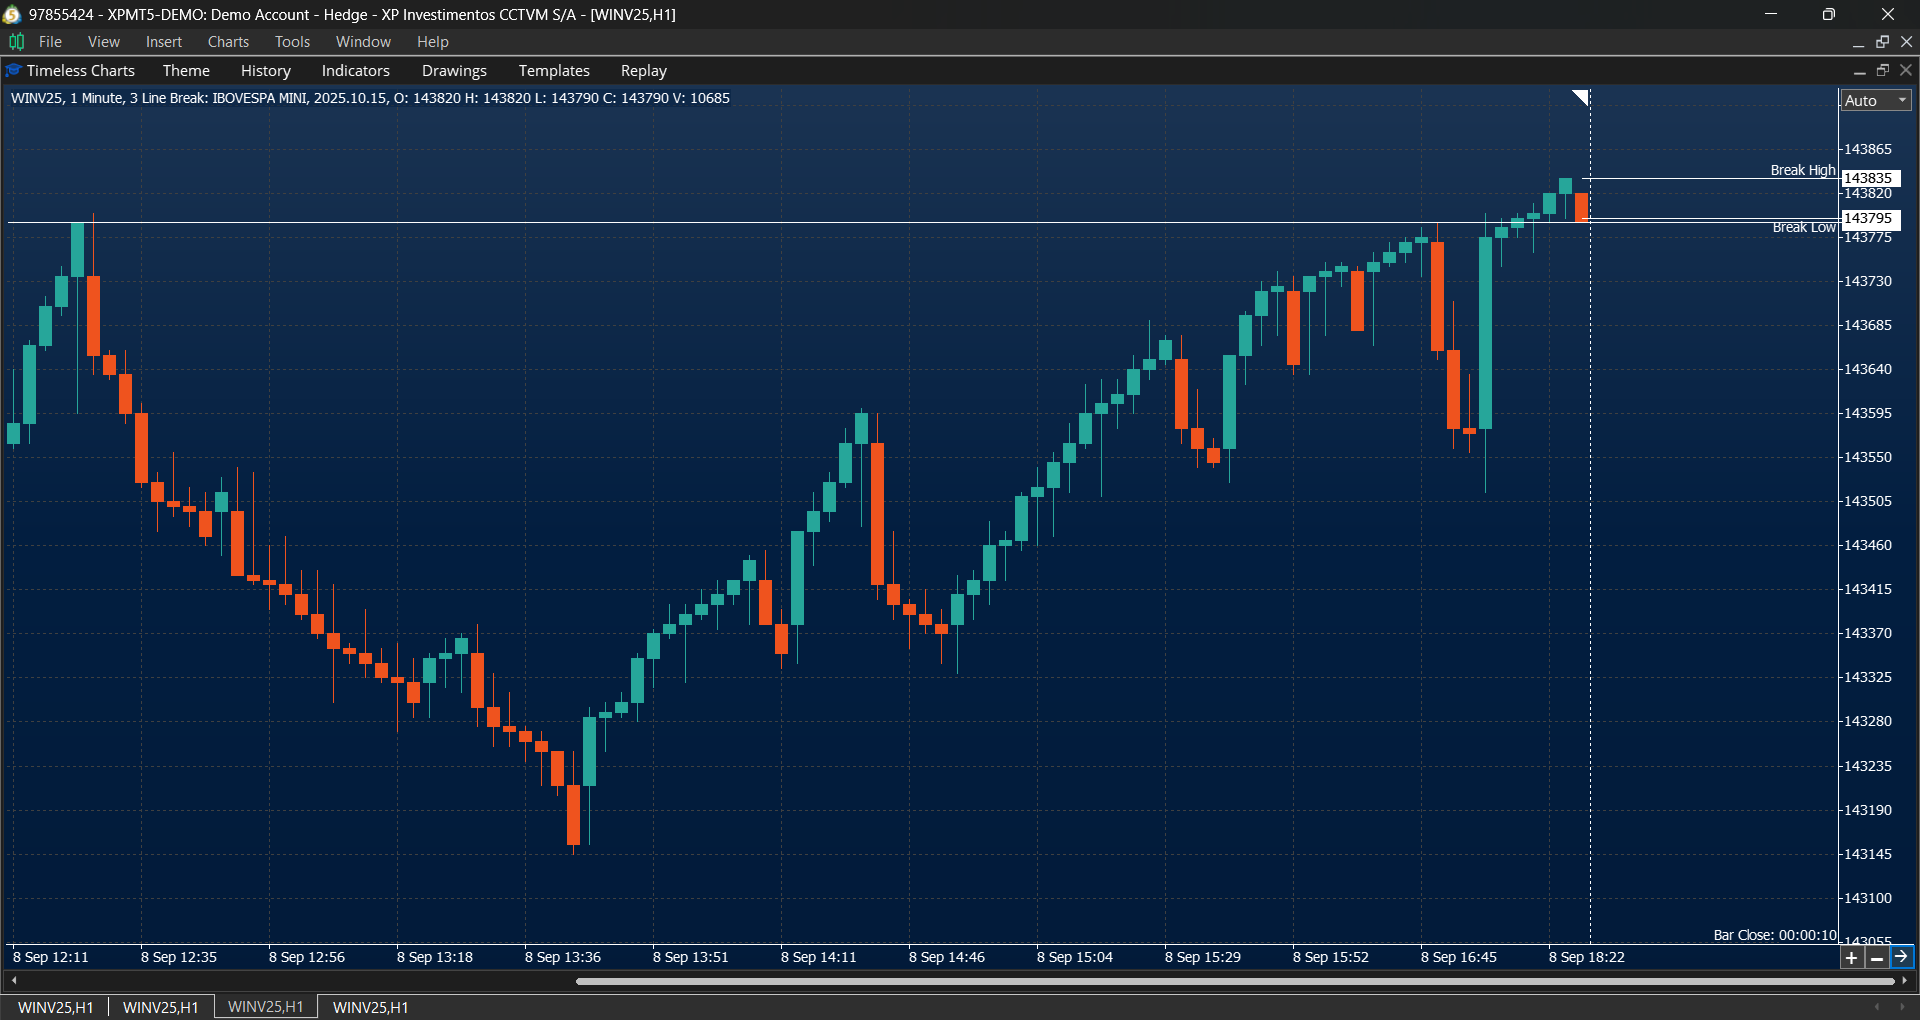
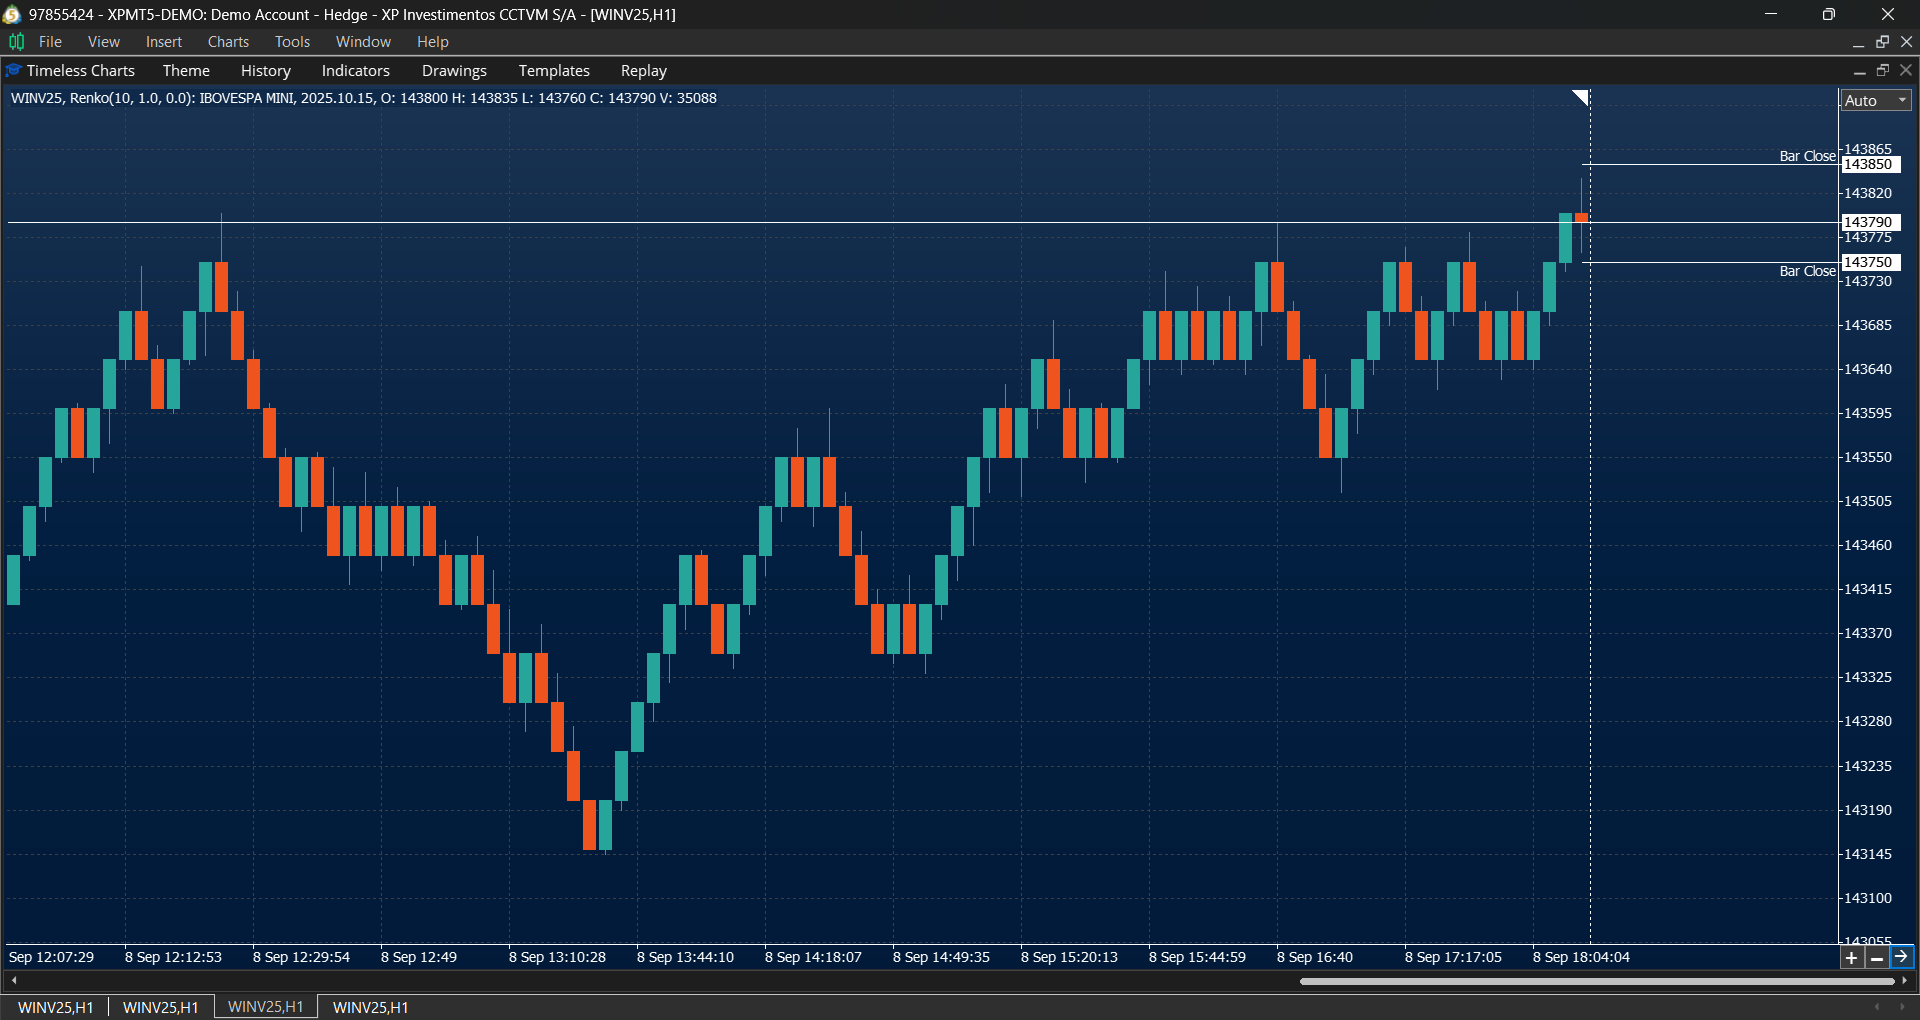
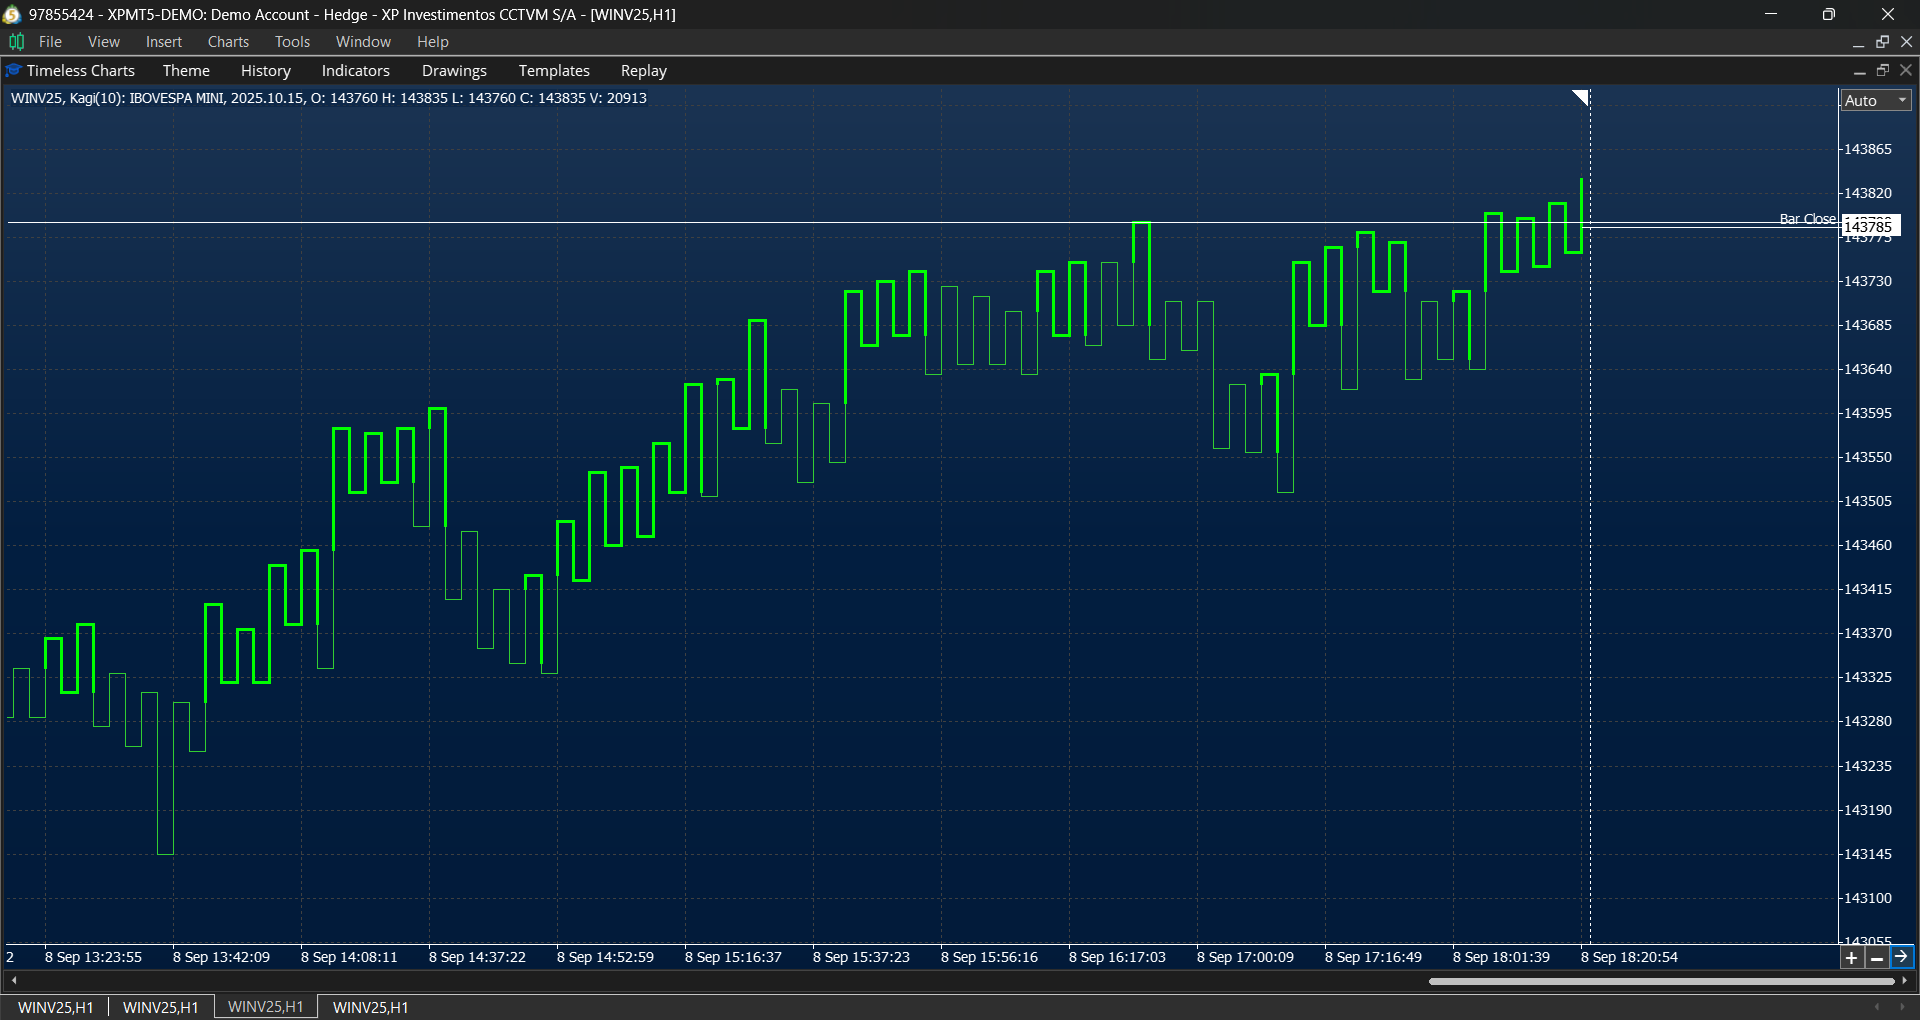
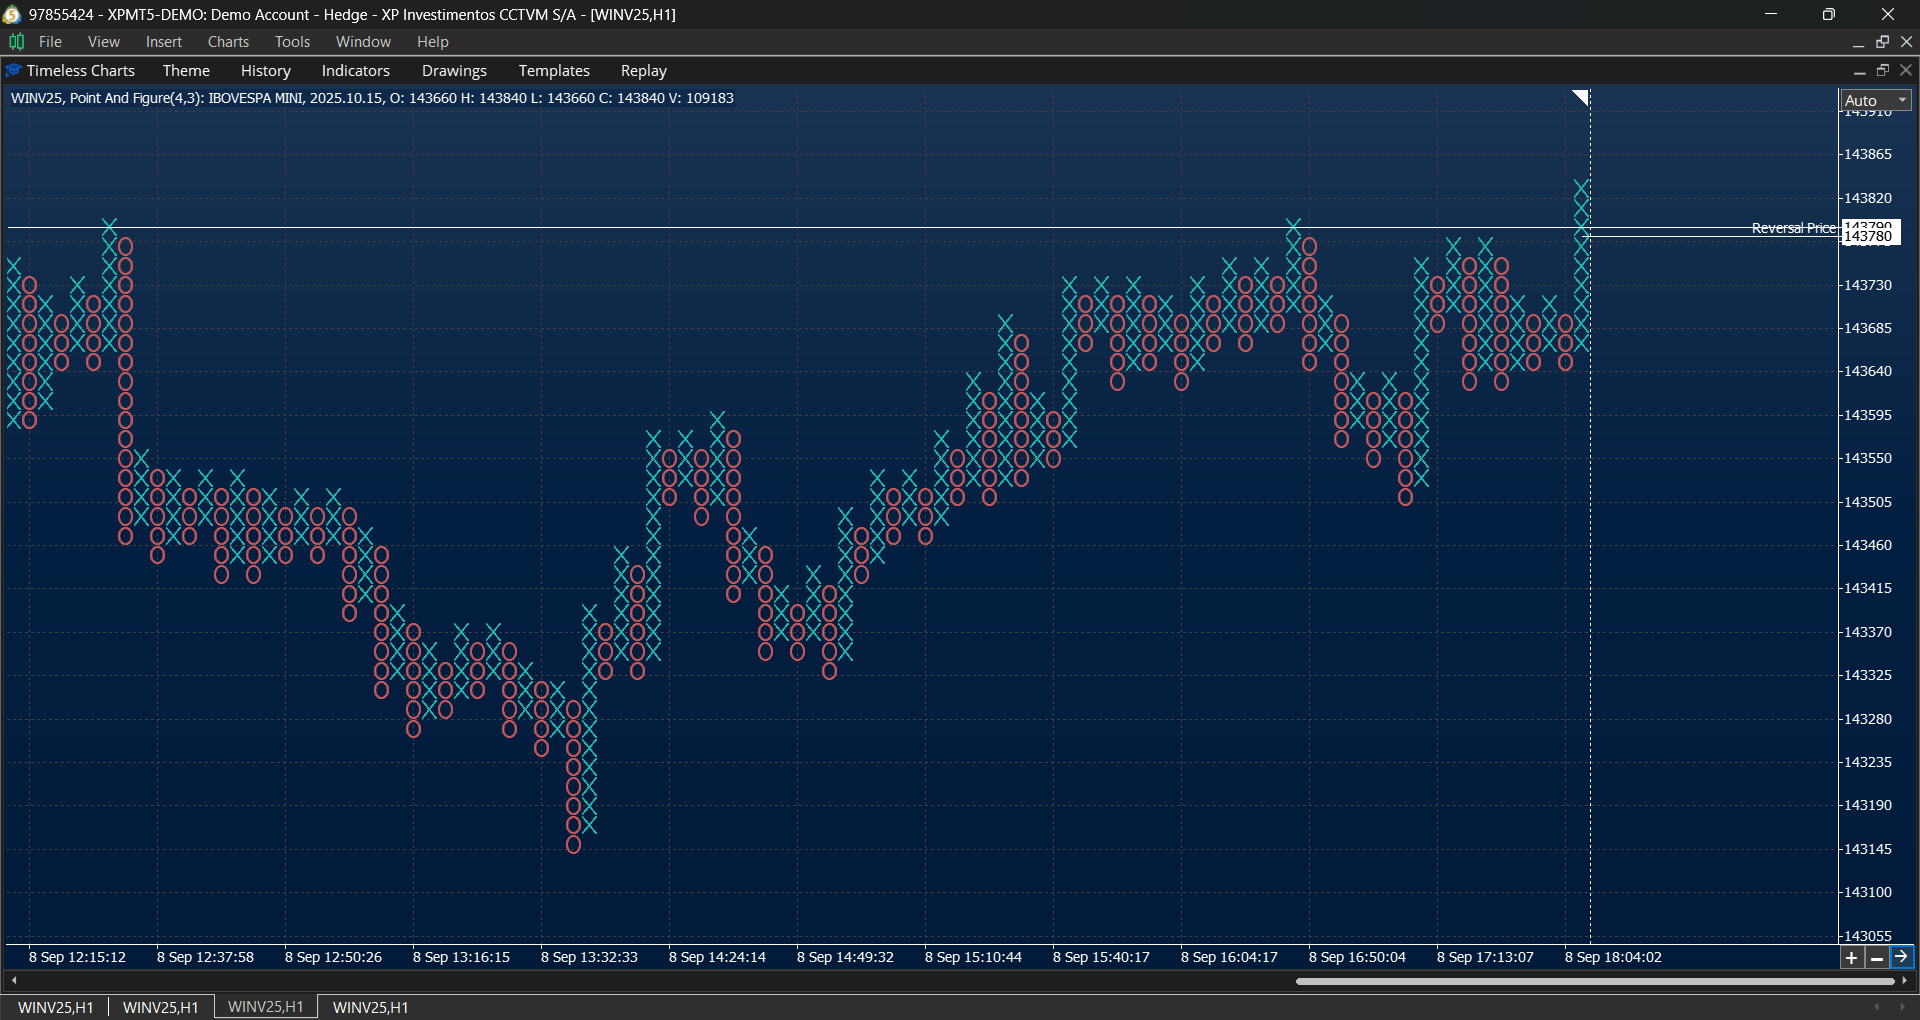
- Price-action charts such as Renko, Range Bars, Line Break, Kagi, and Point & Figure.
Order Flow Analysis
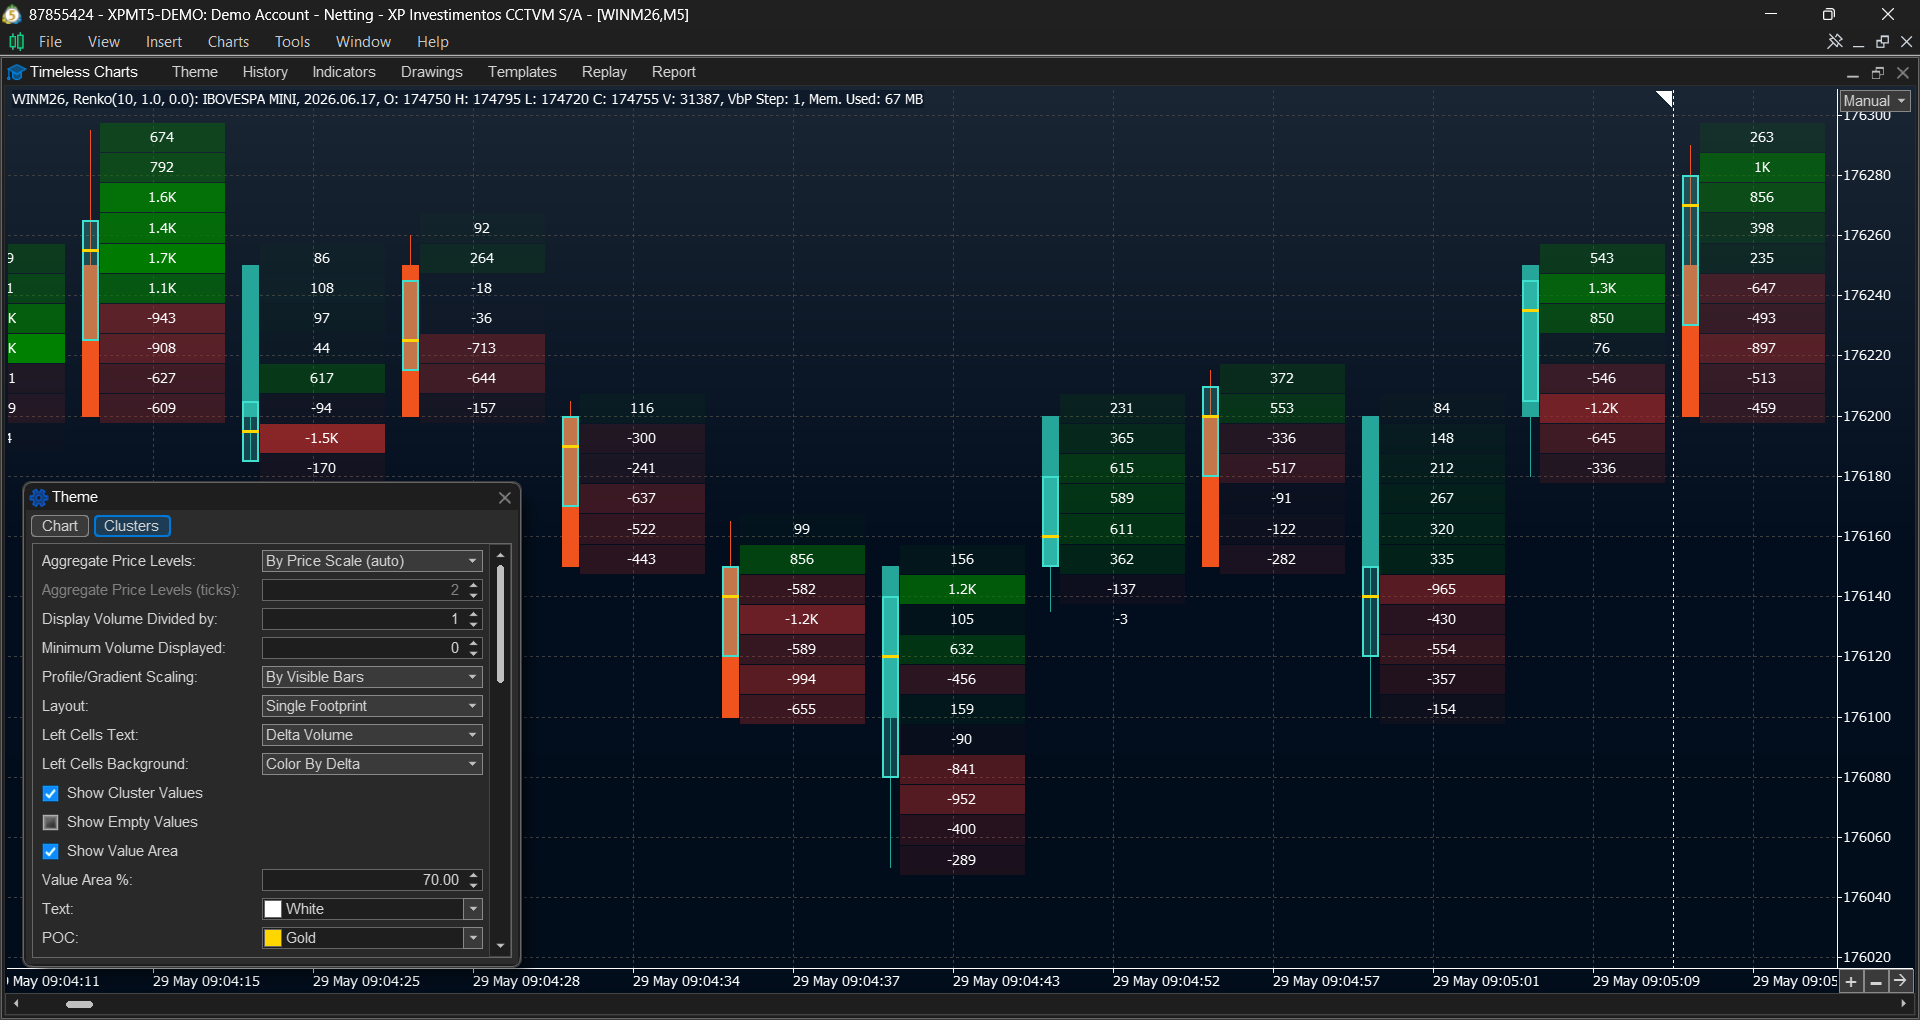
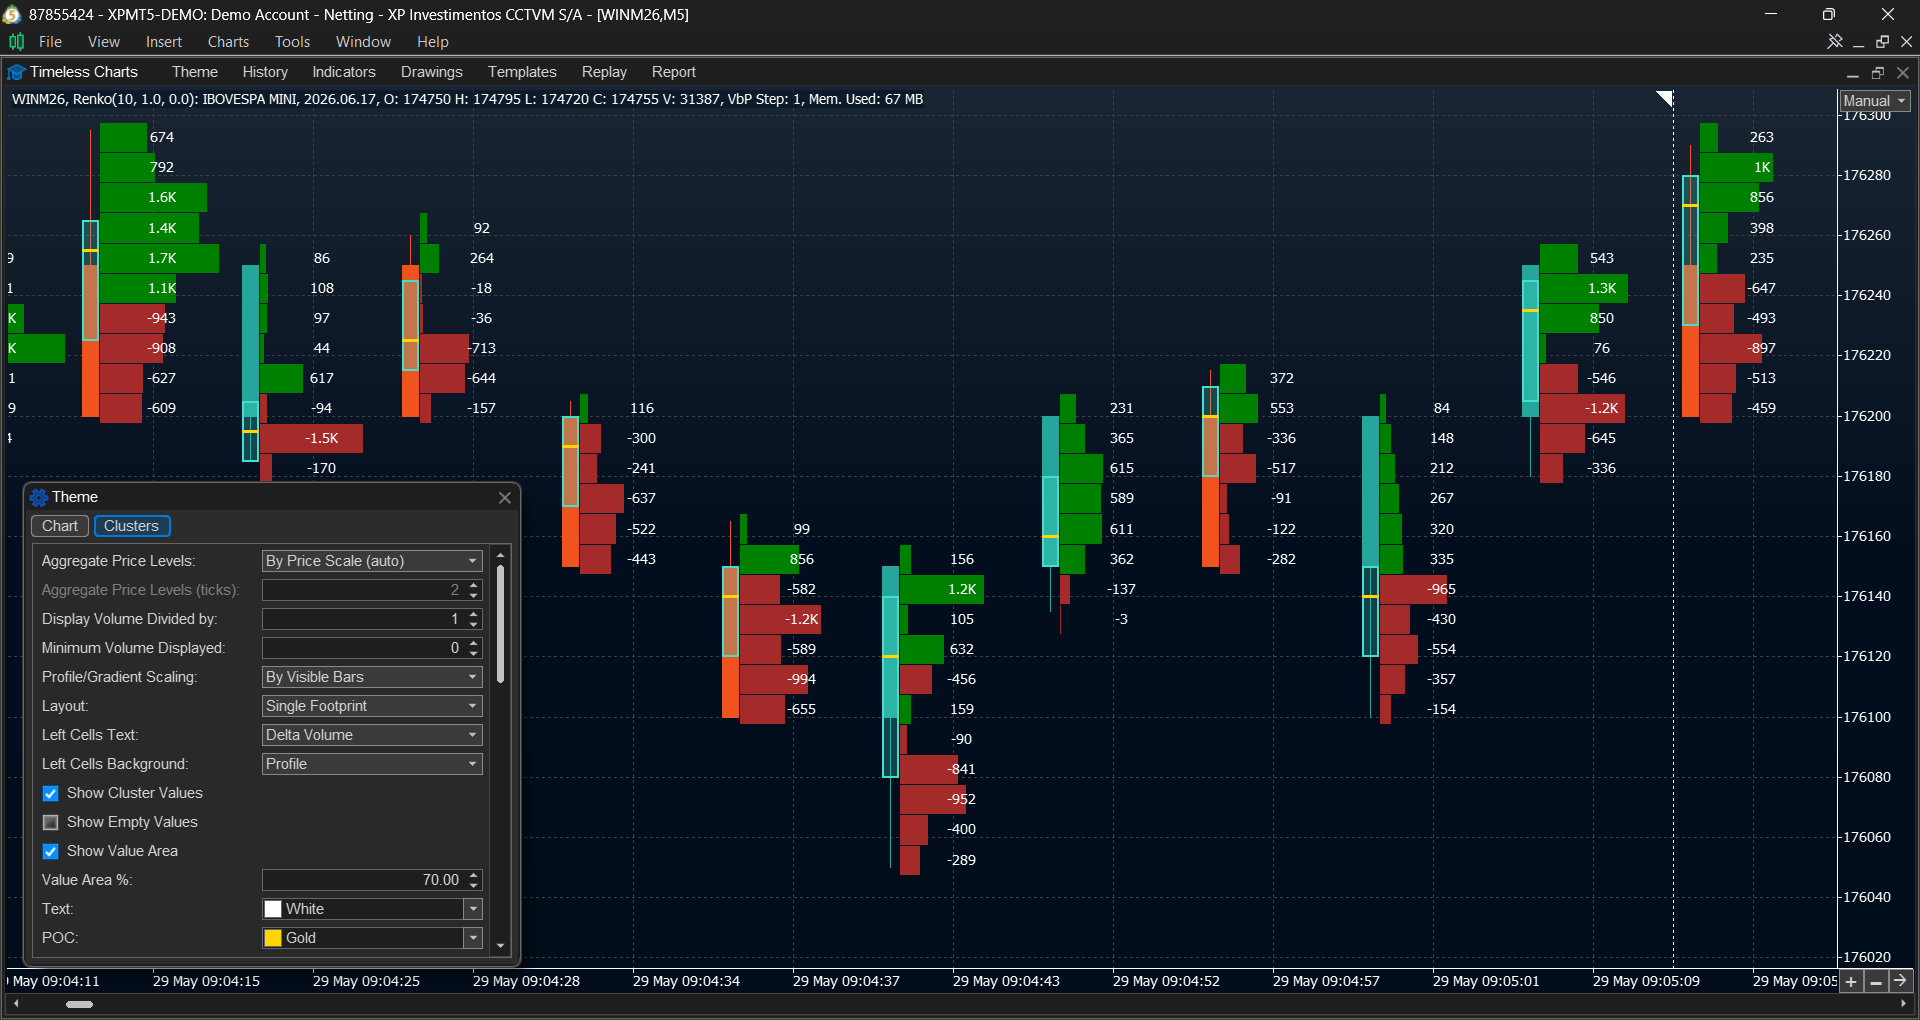
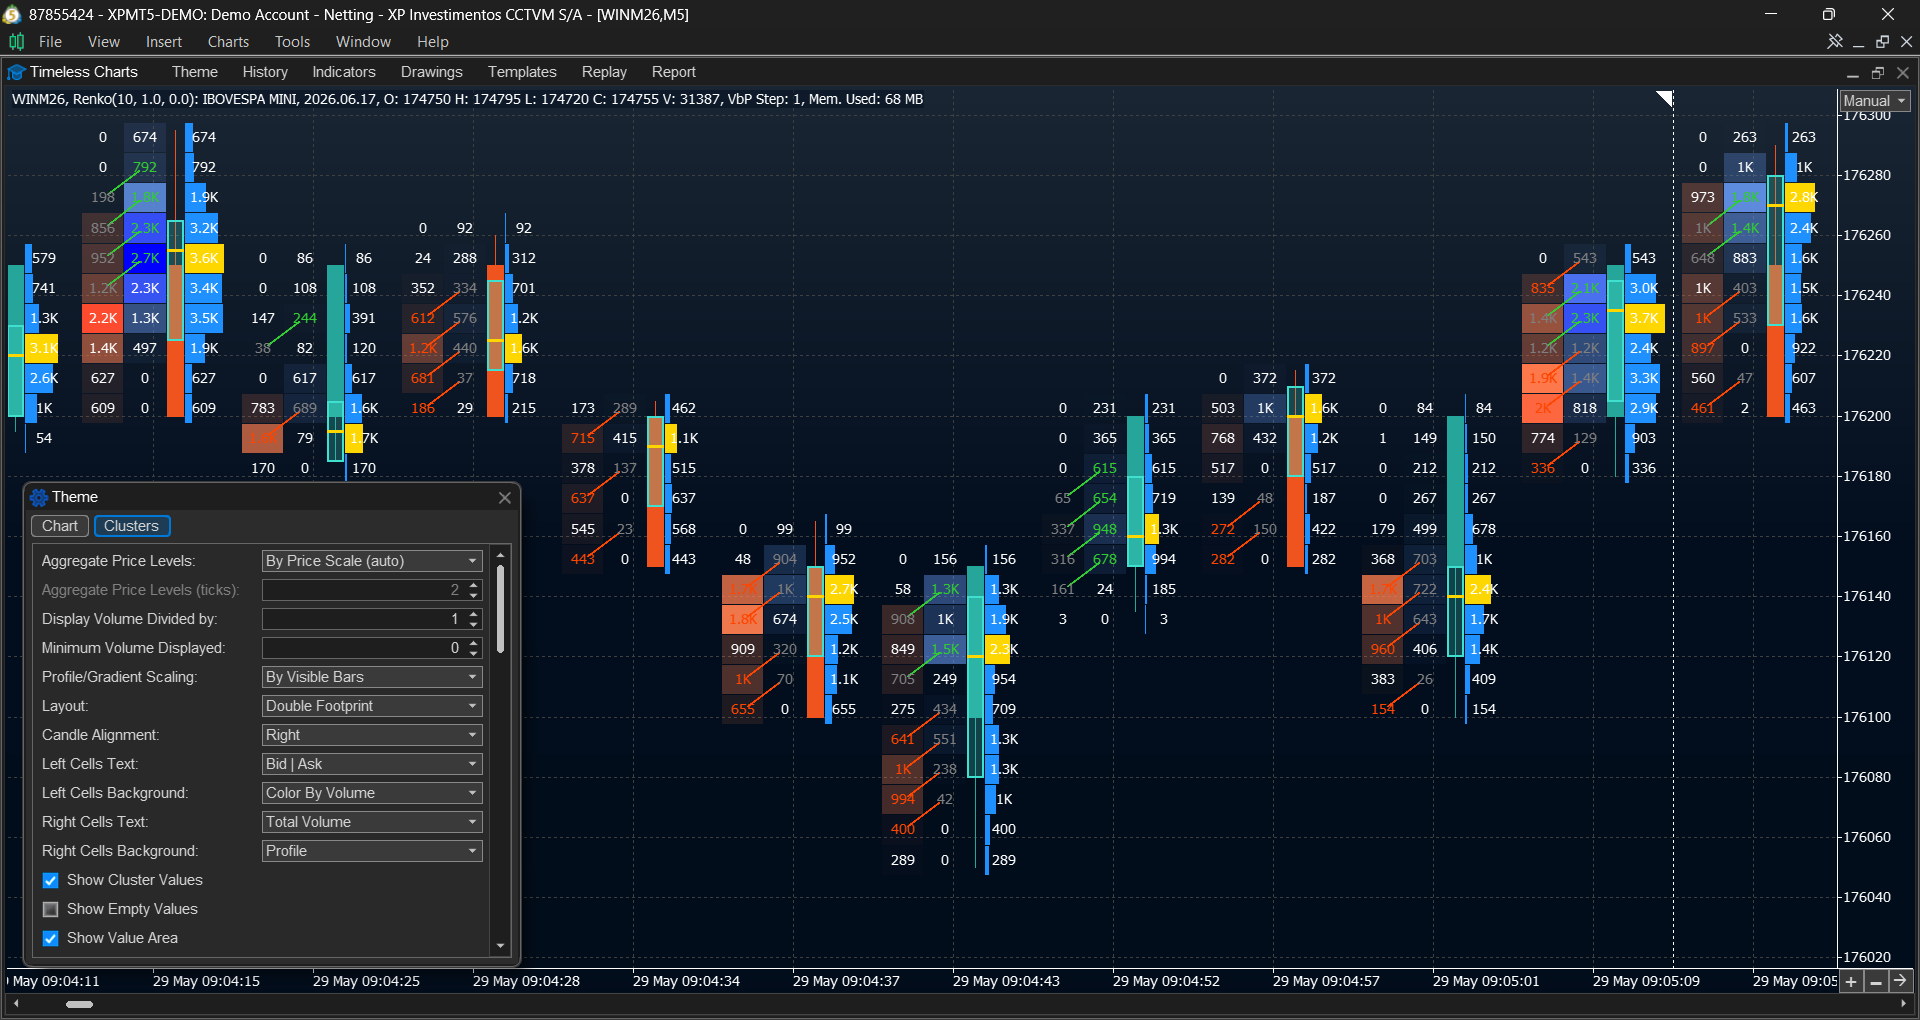
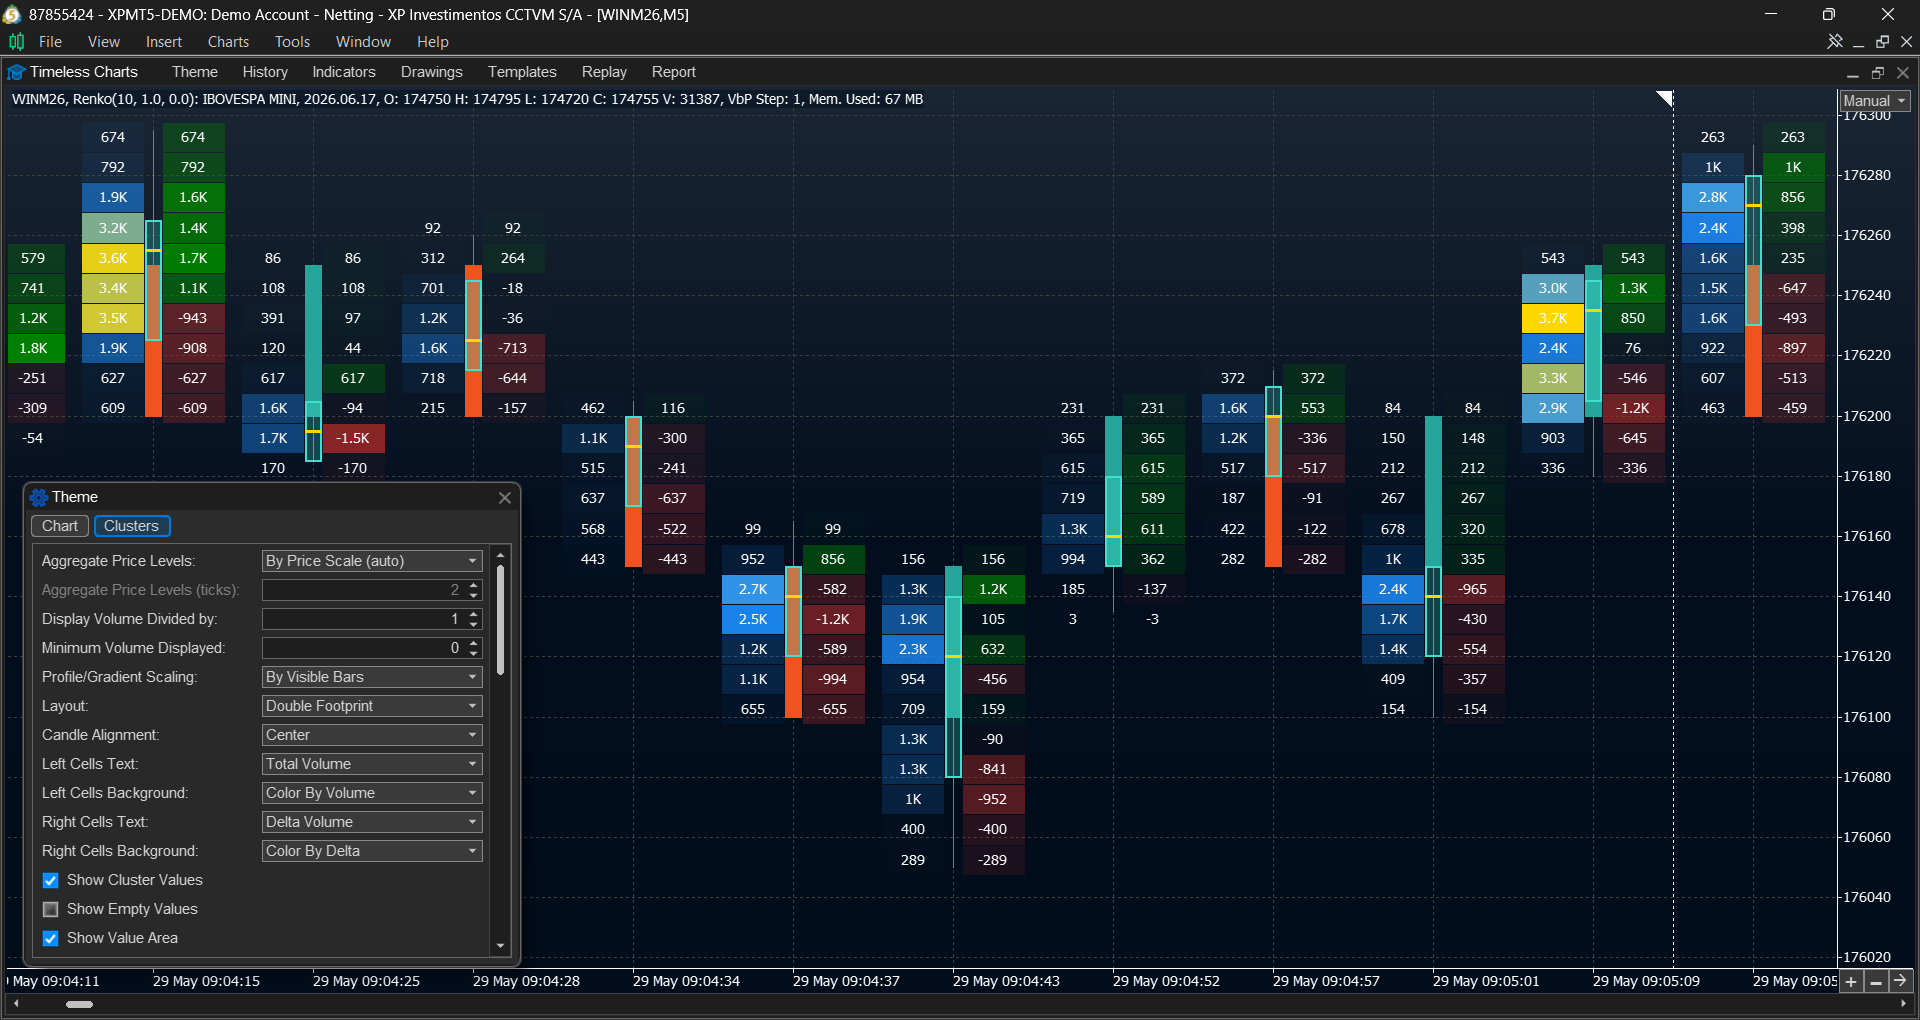
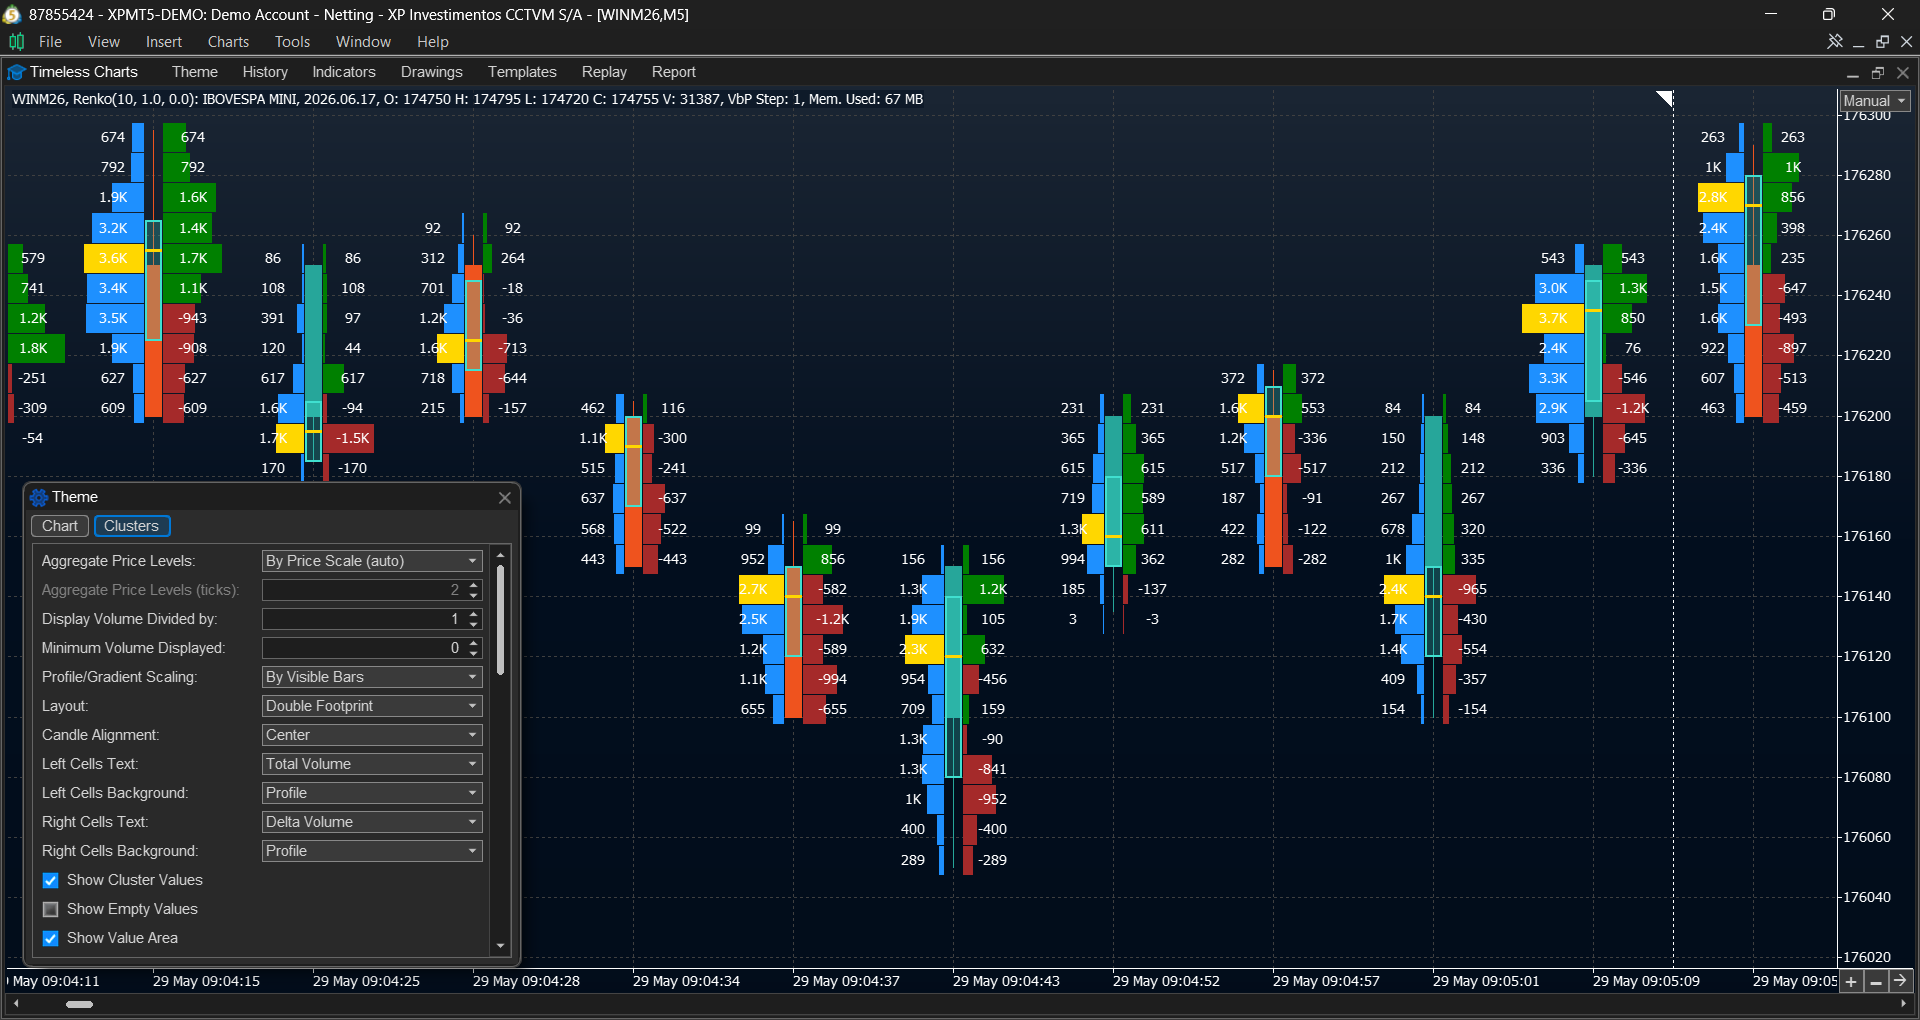
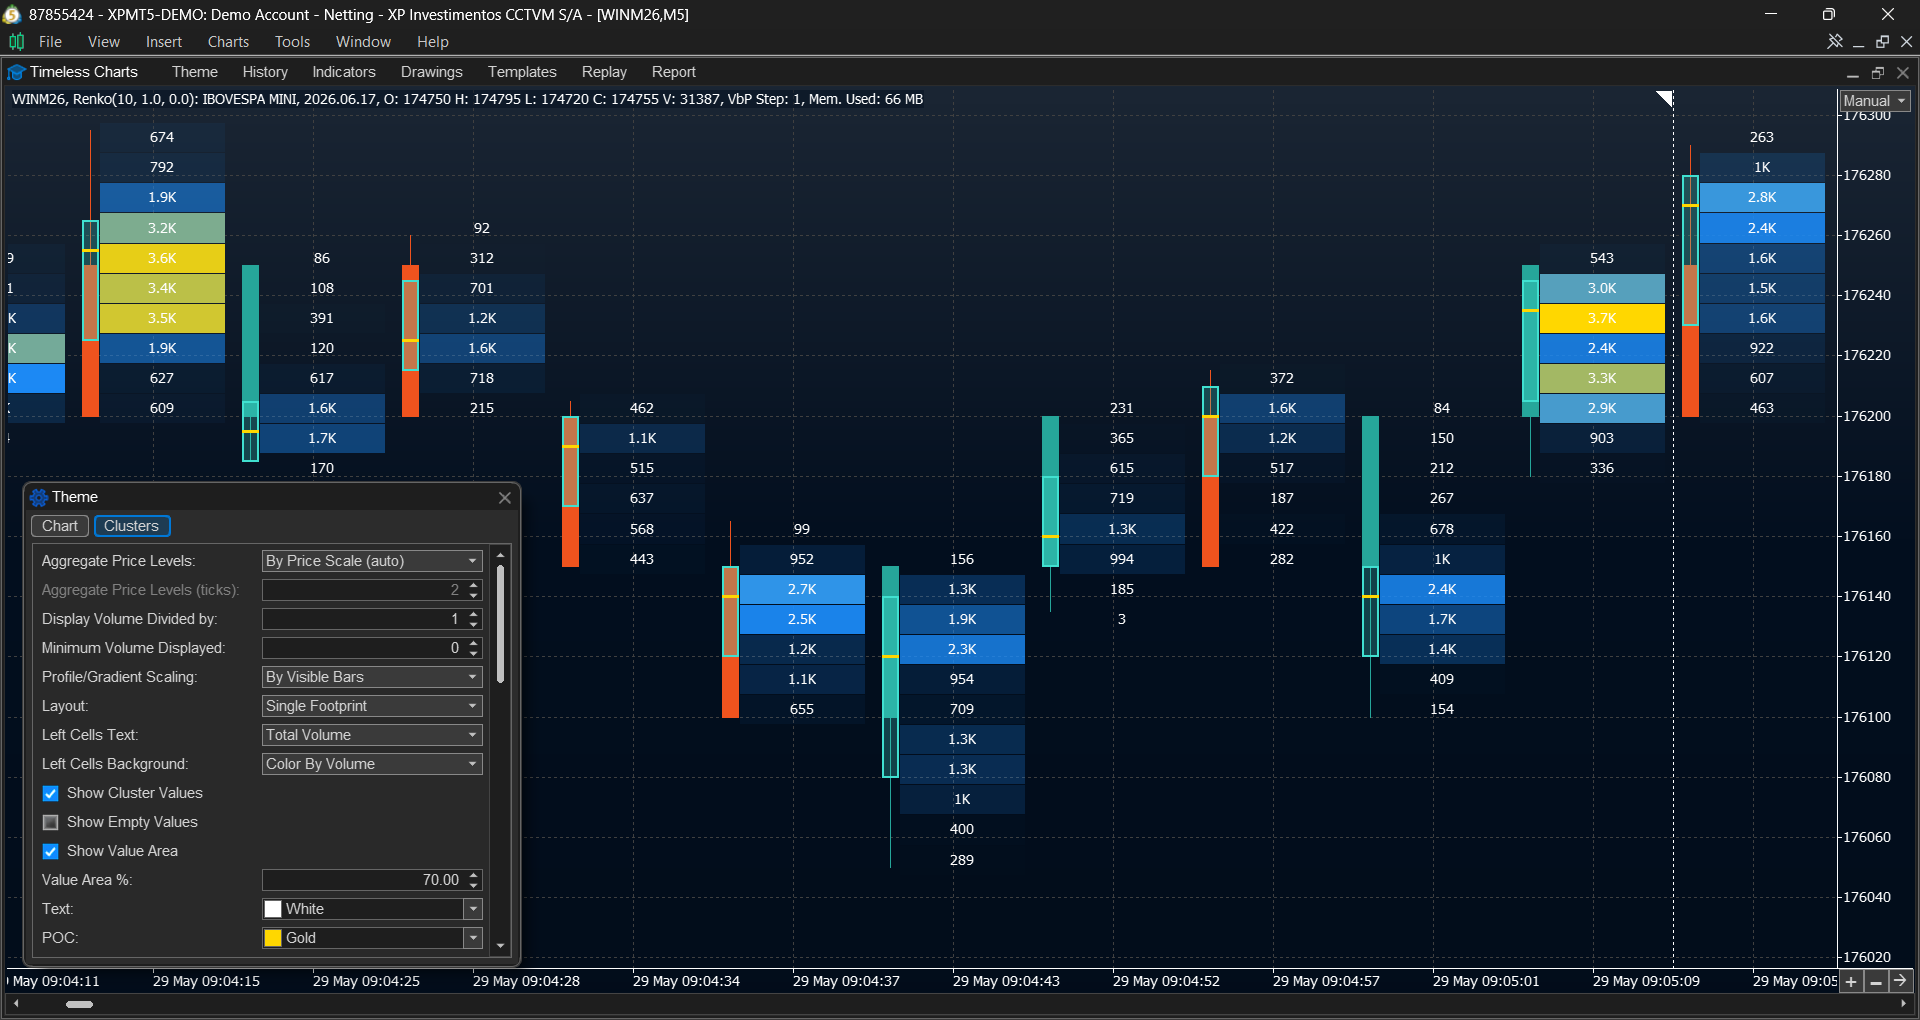
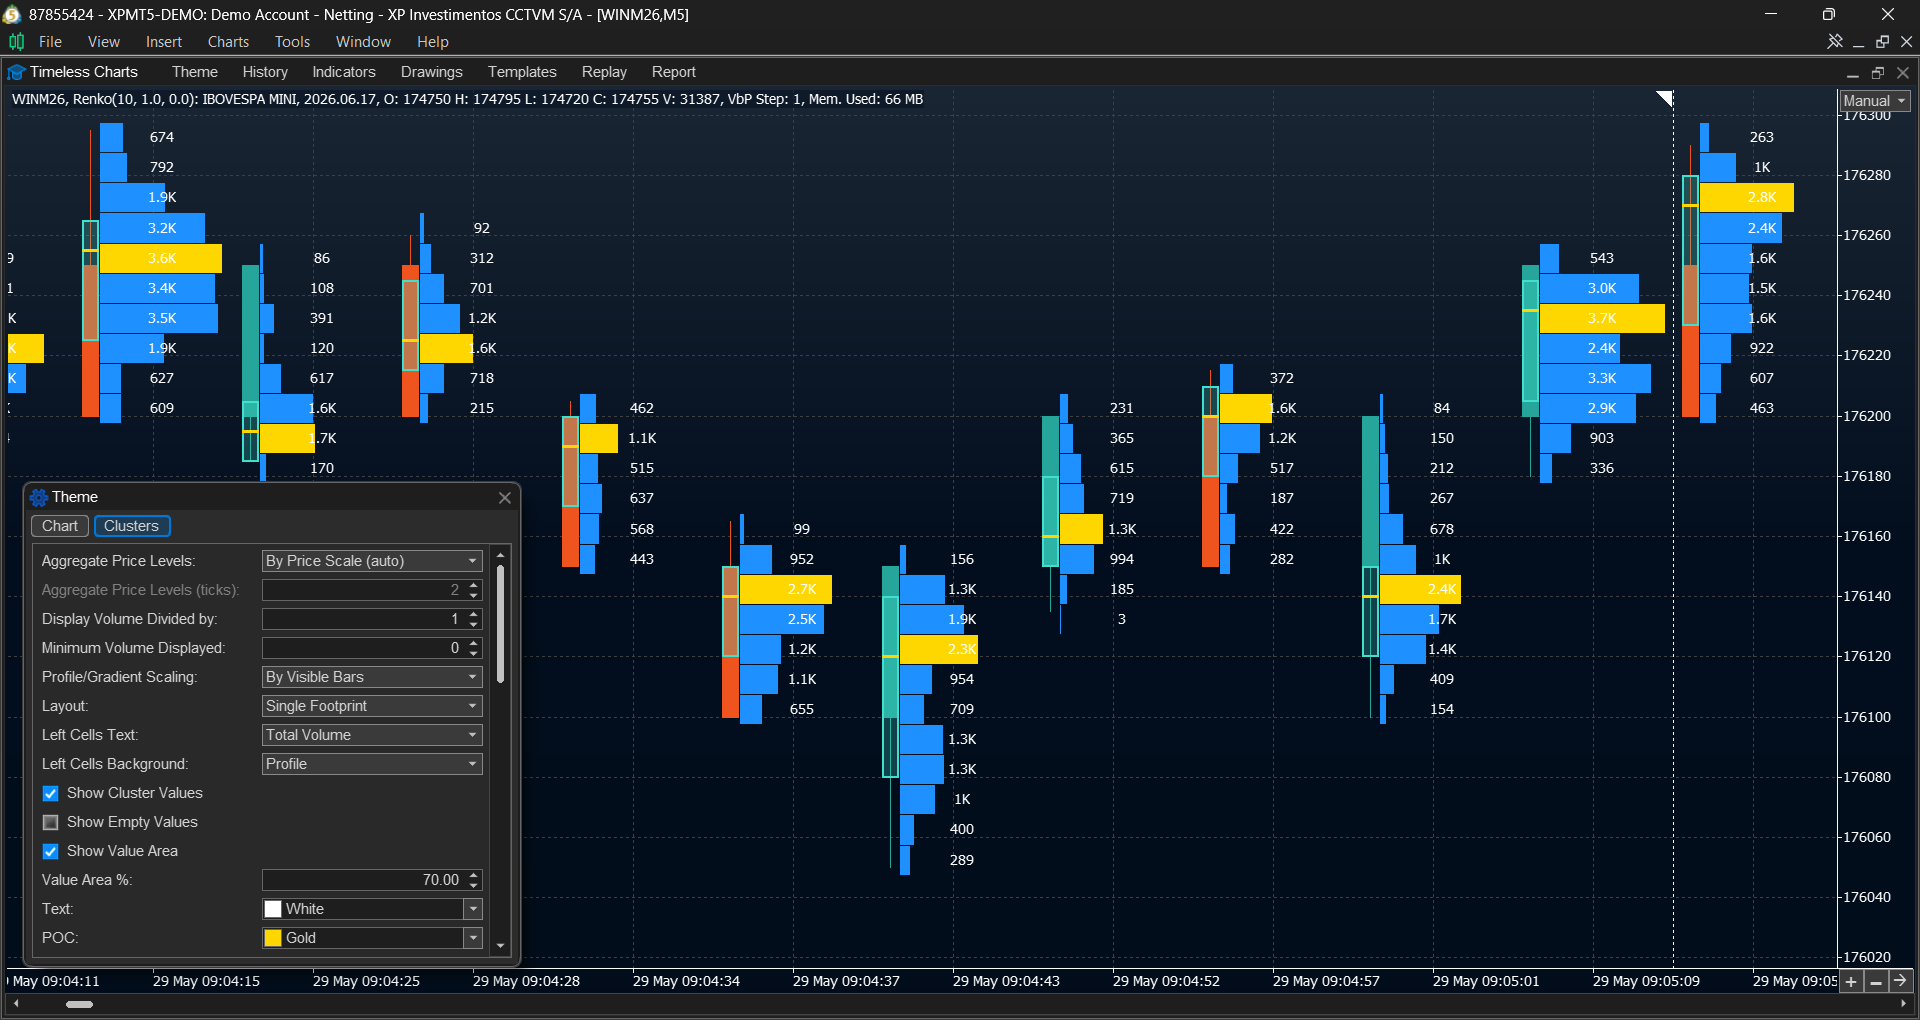
Analyze buying and selling activity at each price level using Footprint Charts, Cluster Charts, and configurable order flow tools designed to reveal market participation and volume distribution as price develops.
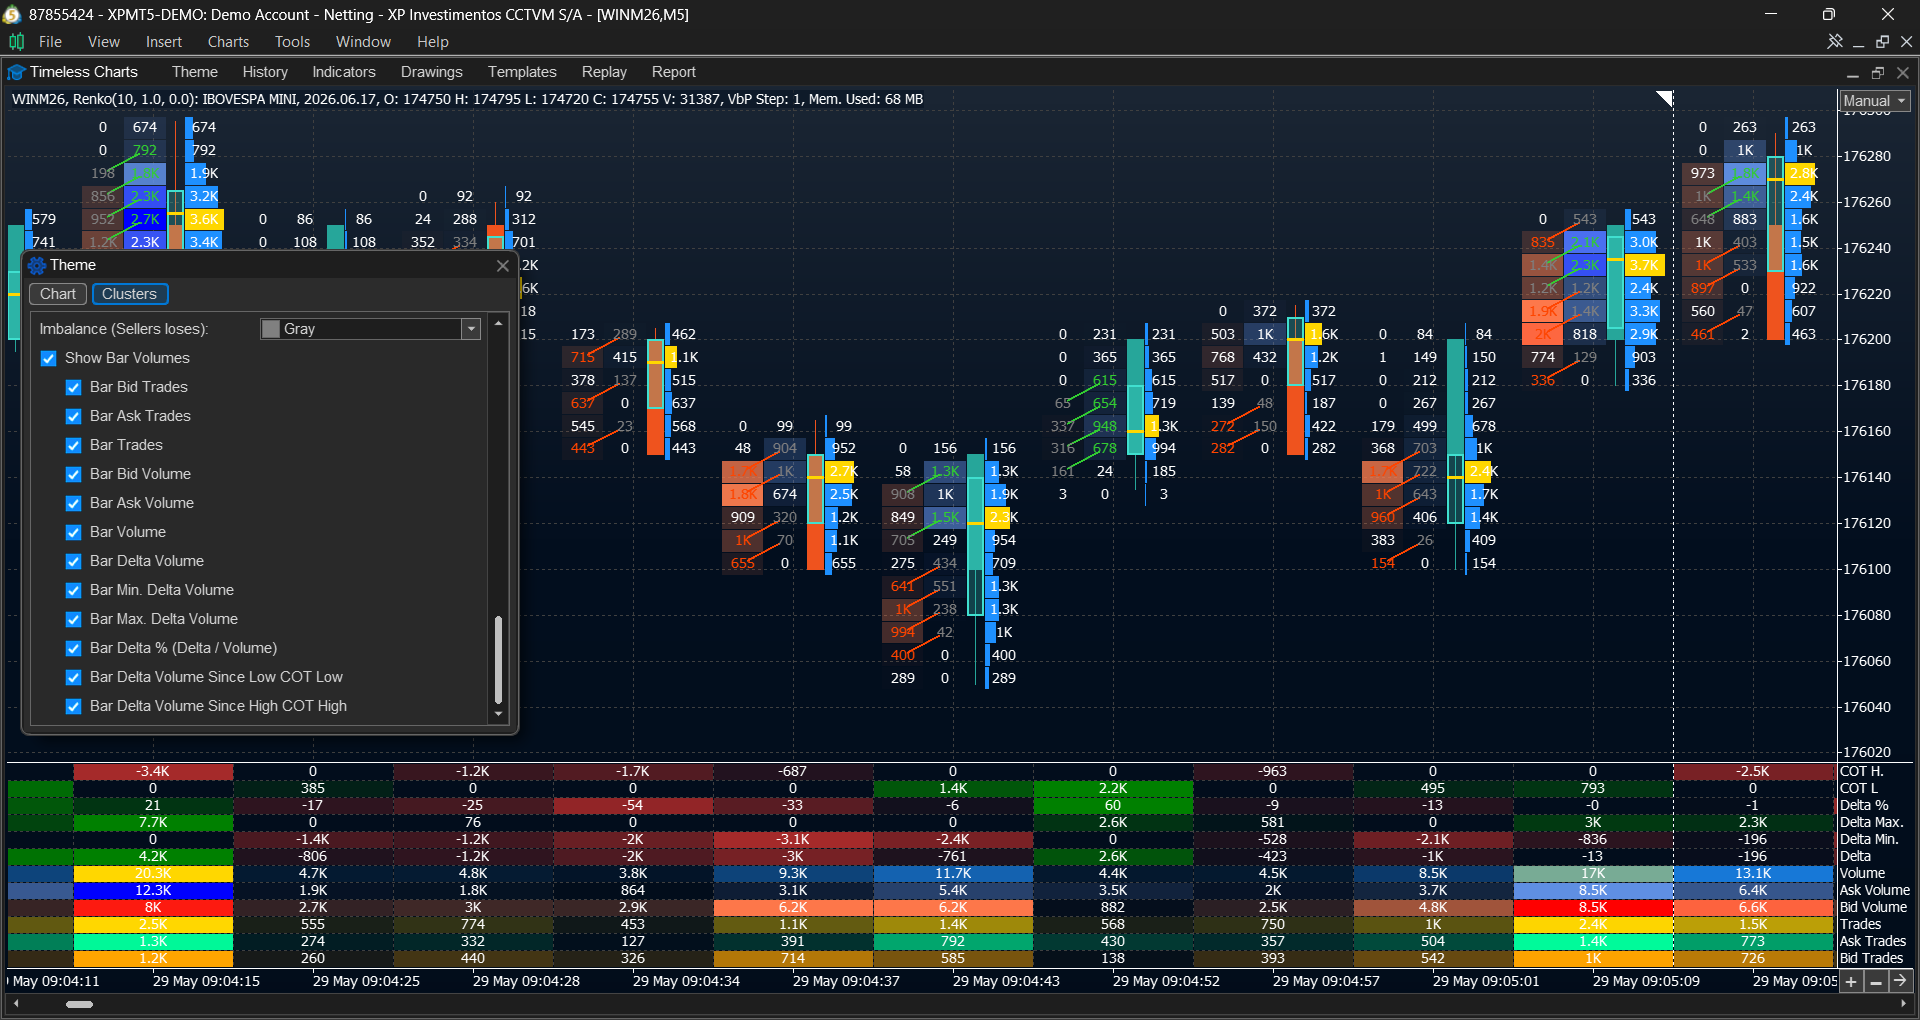
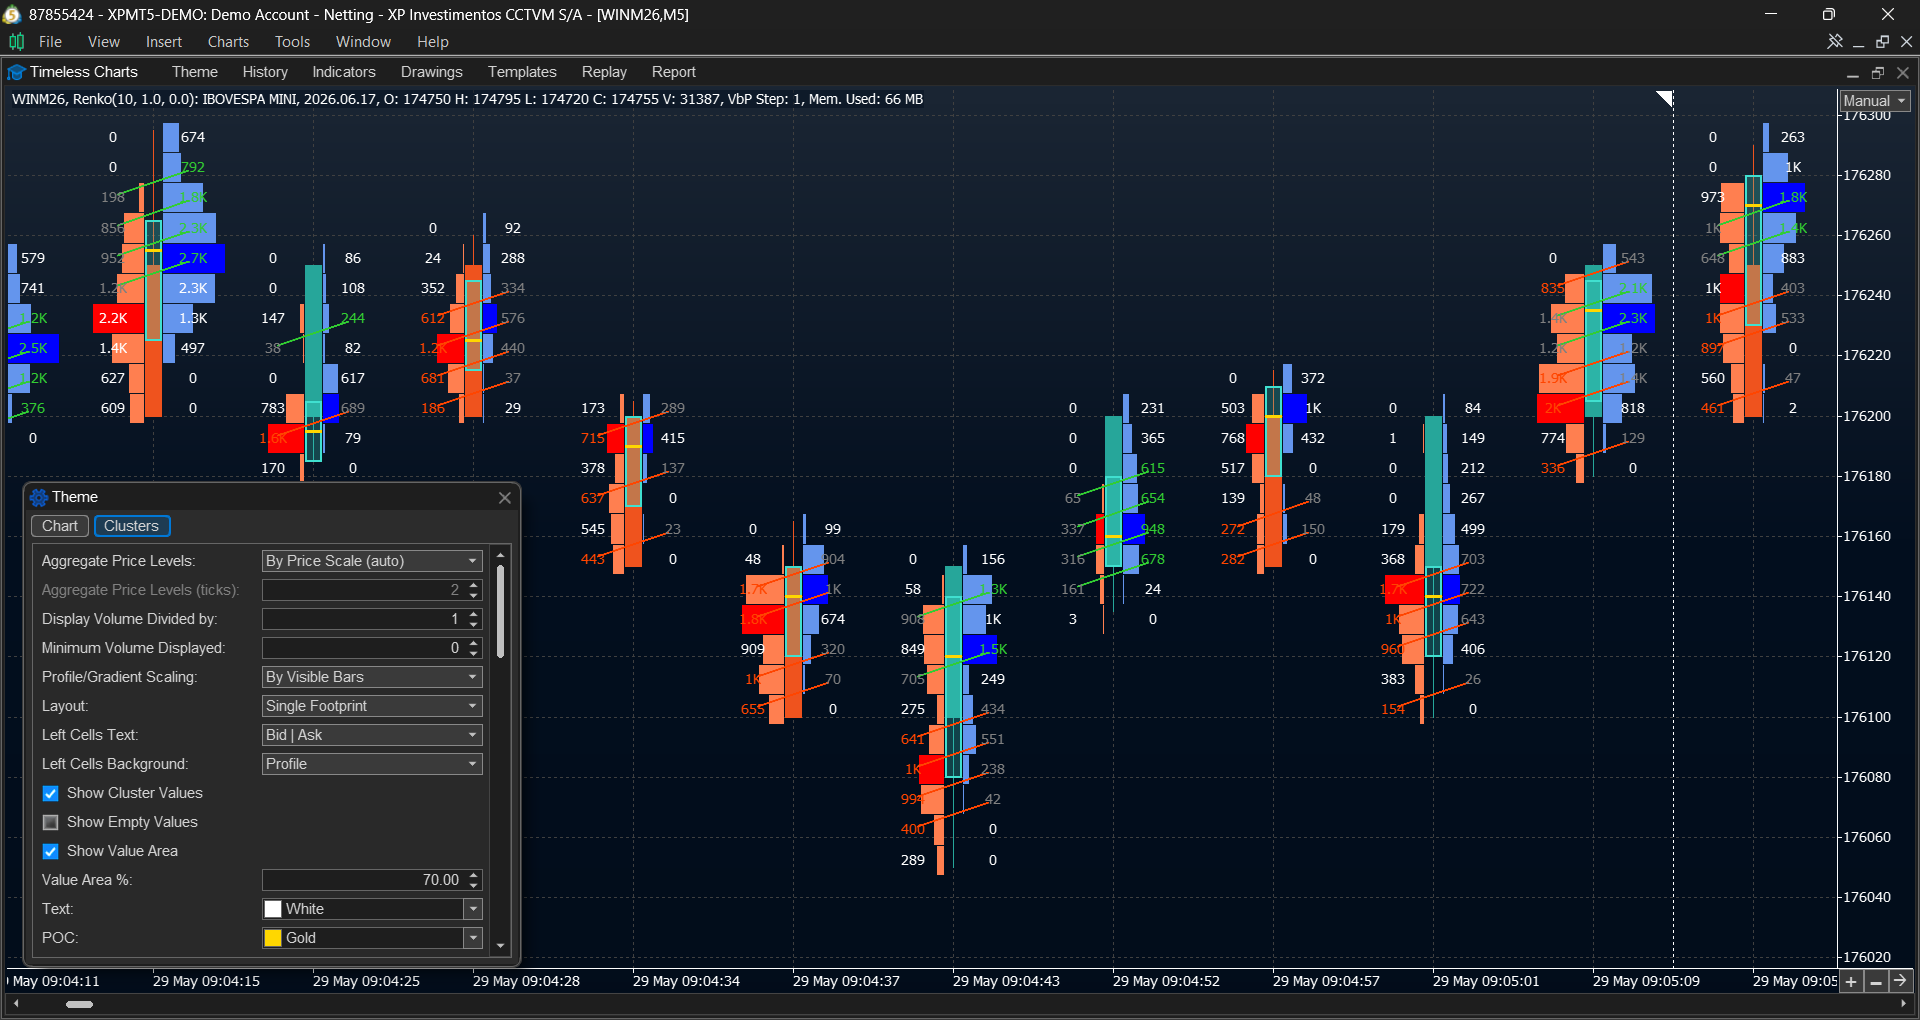
- Footprint and Cluster Charts displaying Bid × Ask Volume, Delta, and Total Volume at each price level, complemented by detailed Bar Statistics for volume composition and trading activity within each bar.
- Configurable imbalance analysis including imbalance thresholds, stacked imbalances, and diagonal Bid × Ask comparisons.
- Multiple visualization modes including profiles, gradients (heatmaps), and combined footprint layouts such as Volume | Delta and Volume | Bid × Ask.
- Display filters and value compression for improving readability by hiding small values and simplifying large-volume data.
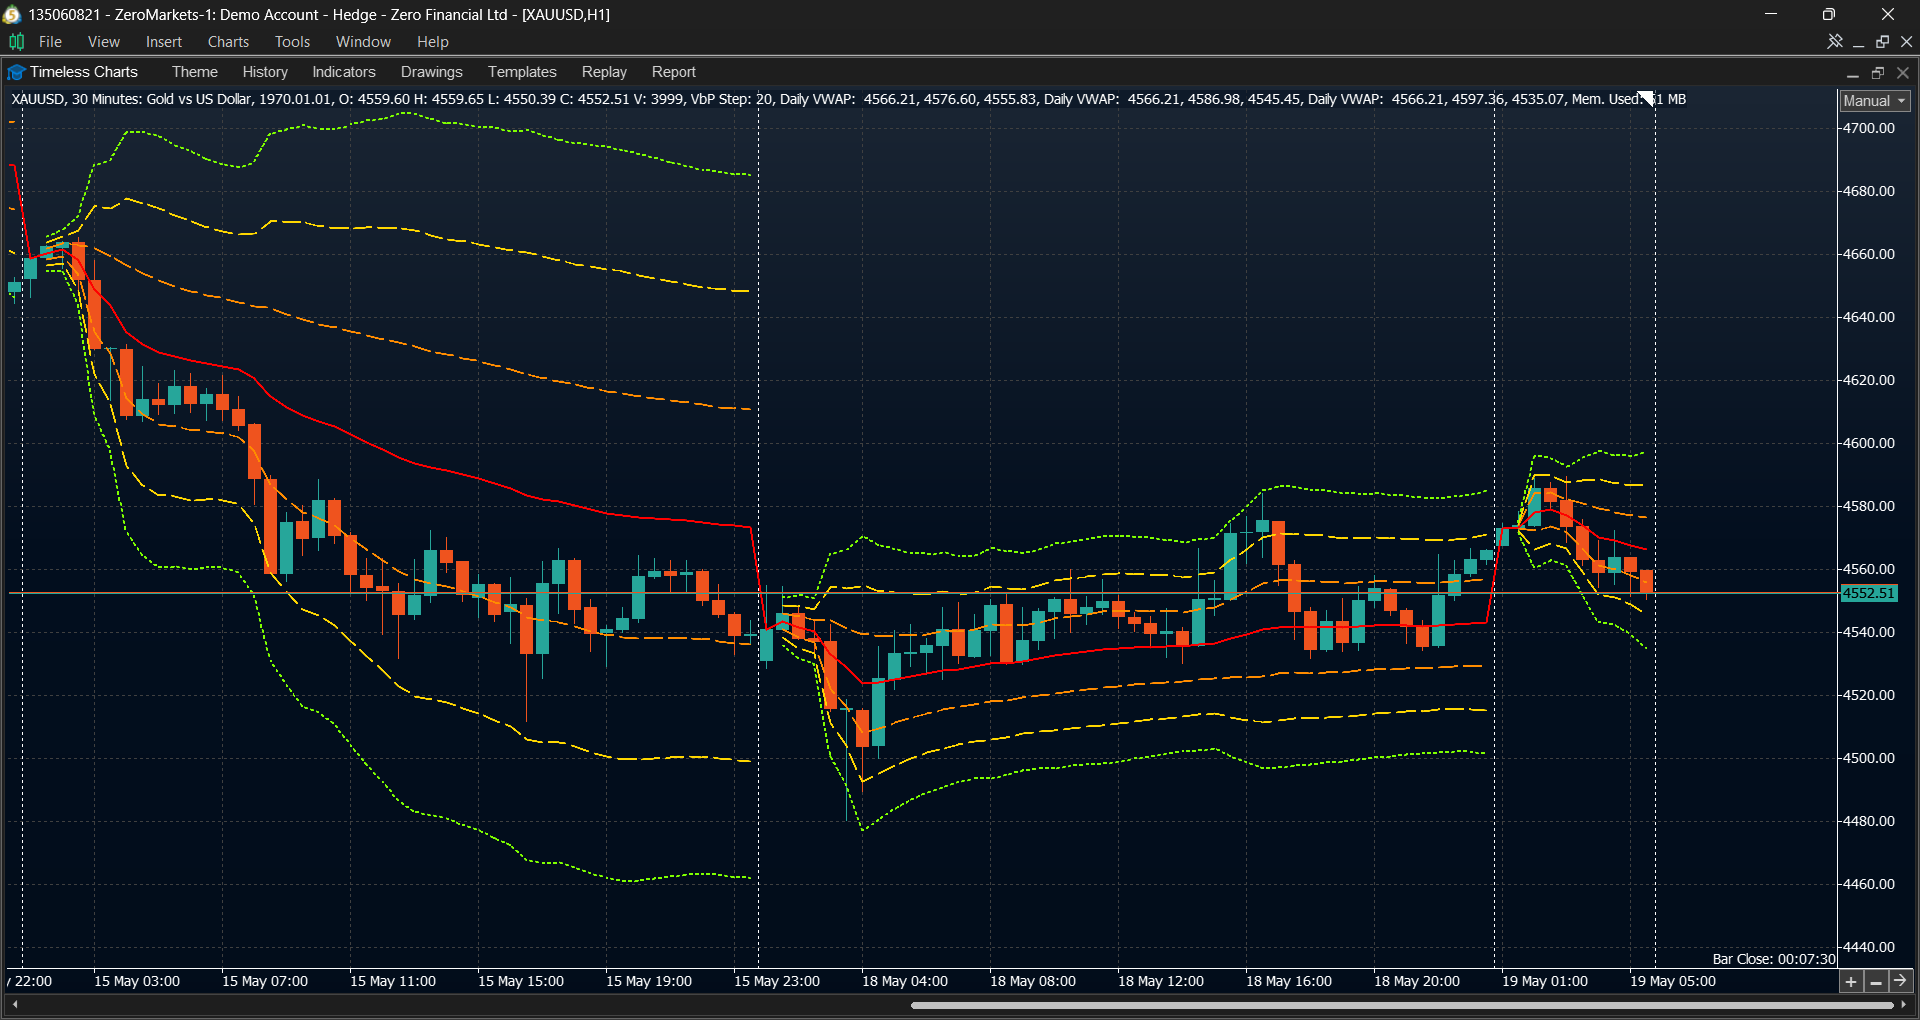
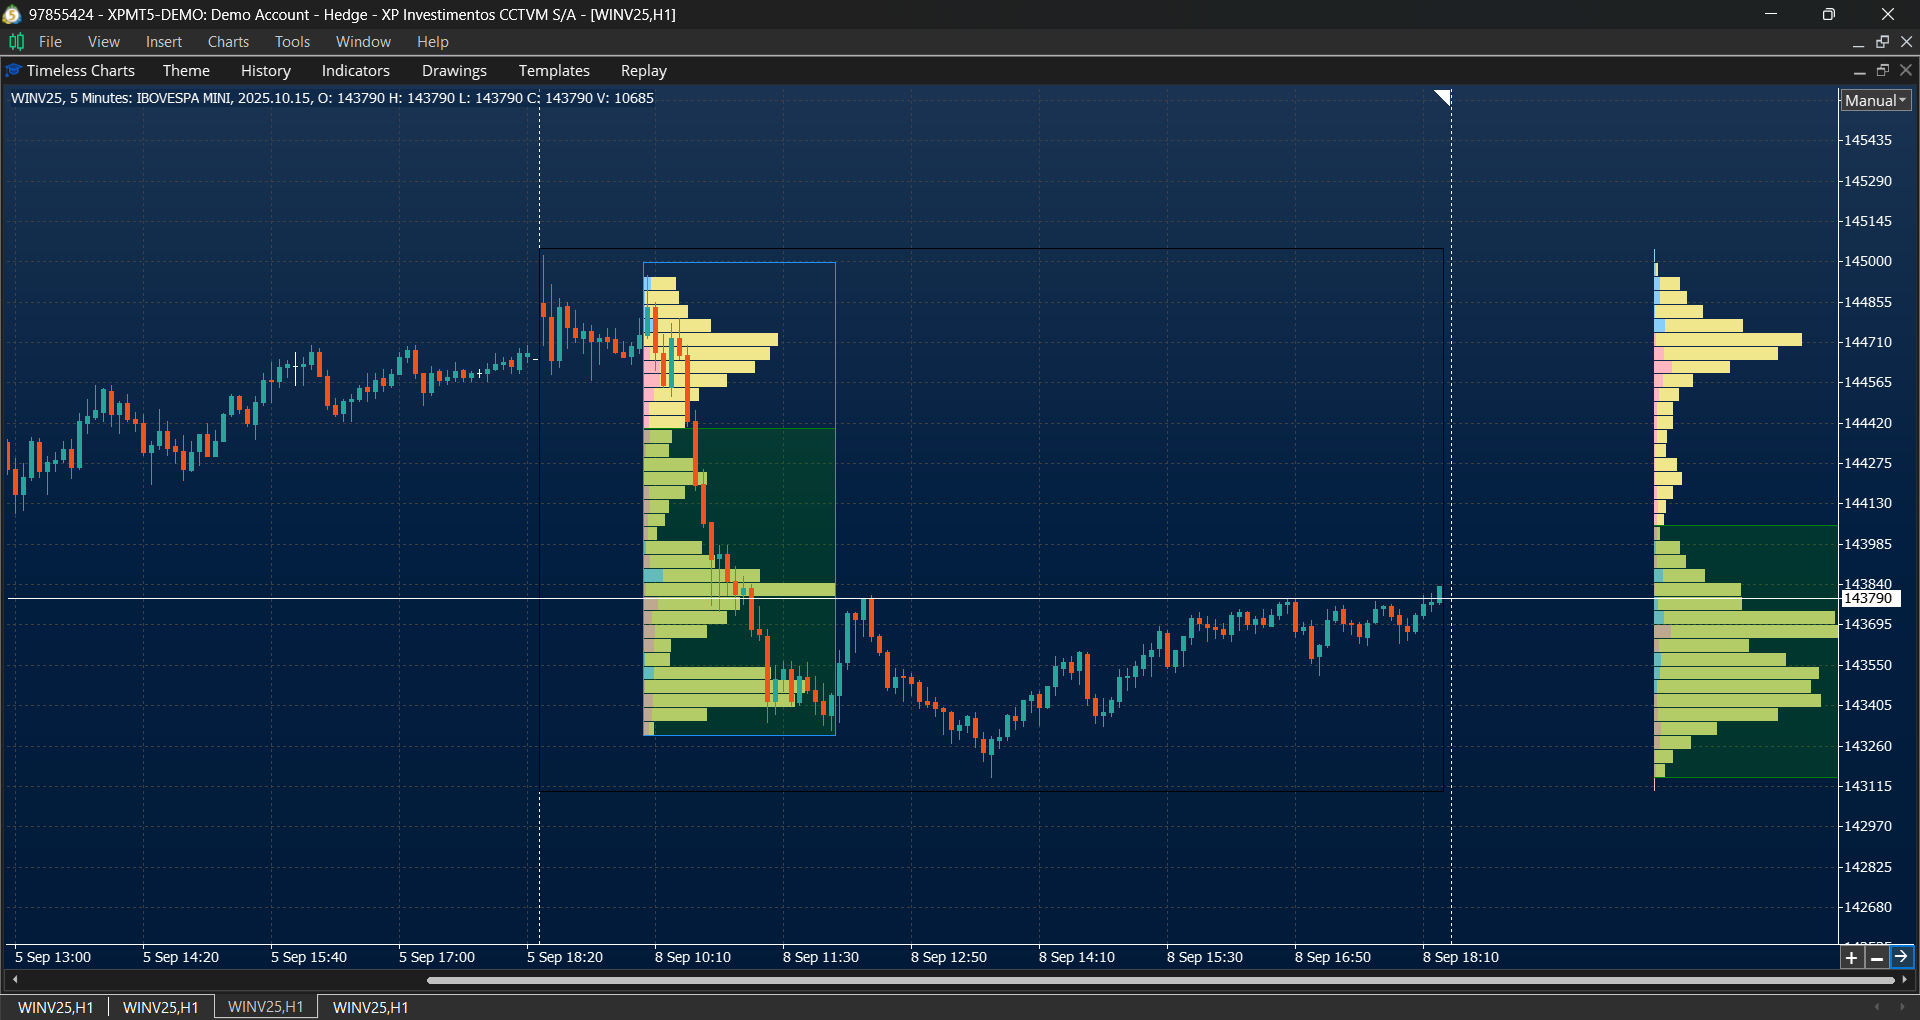
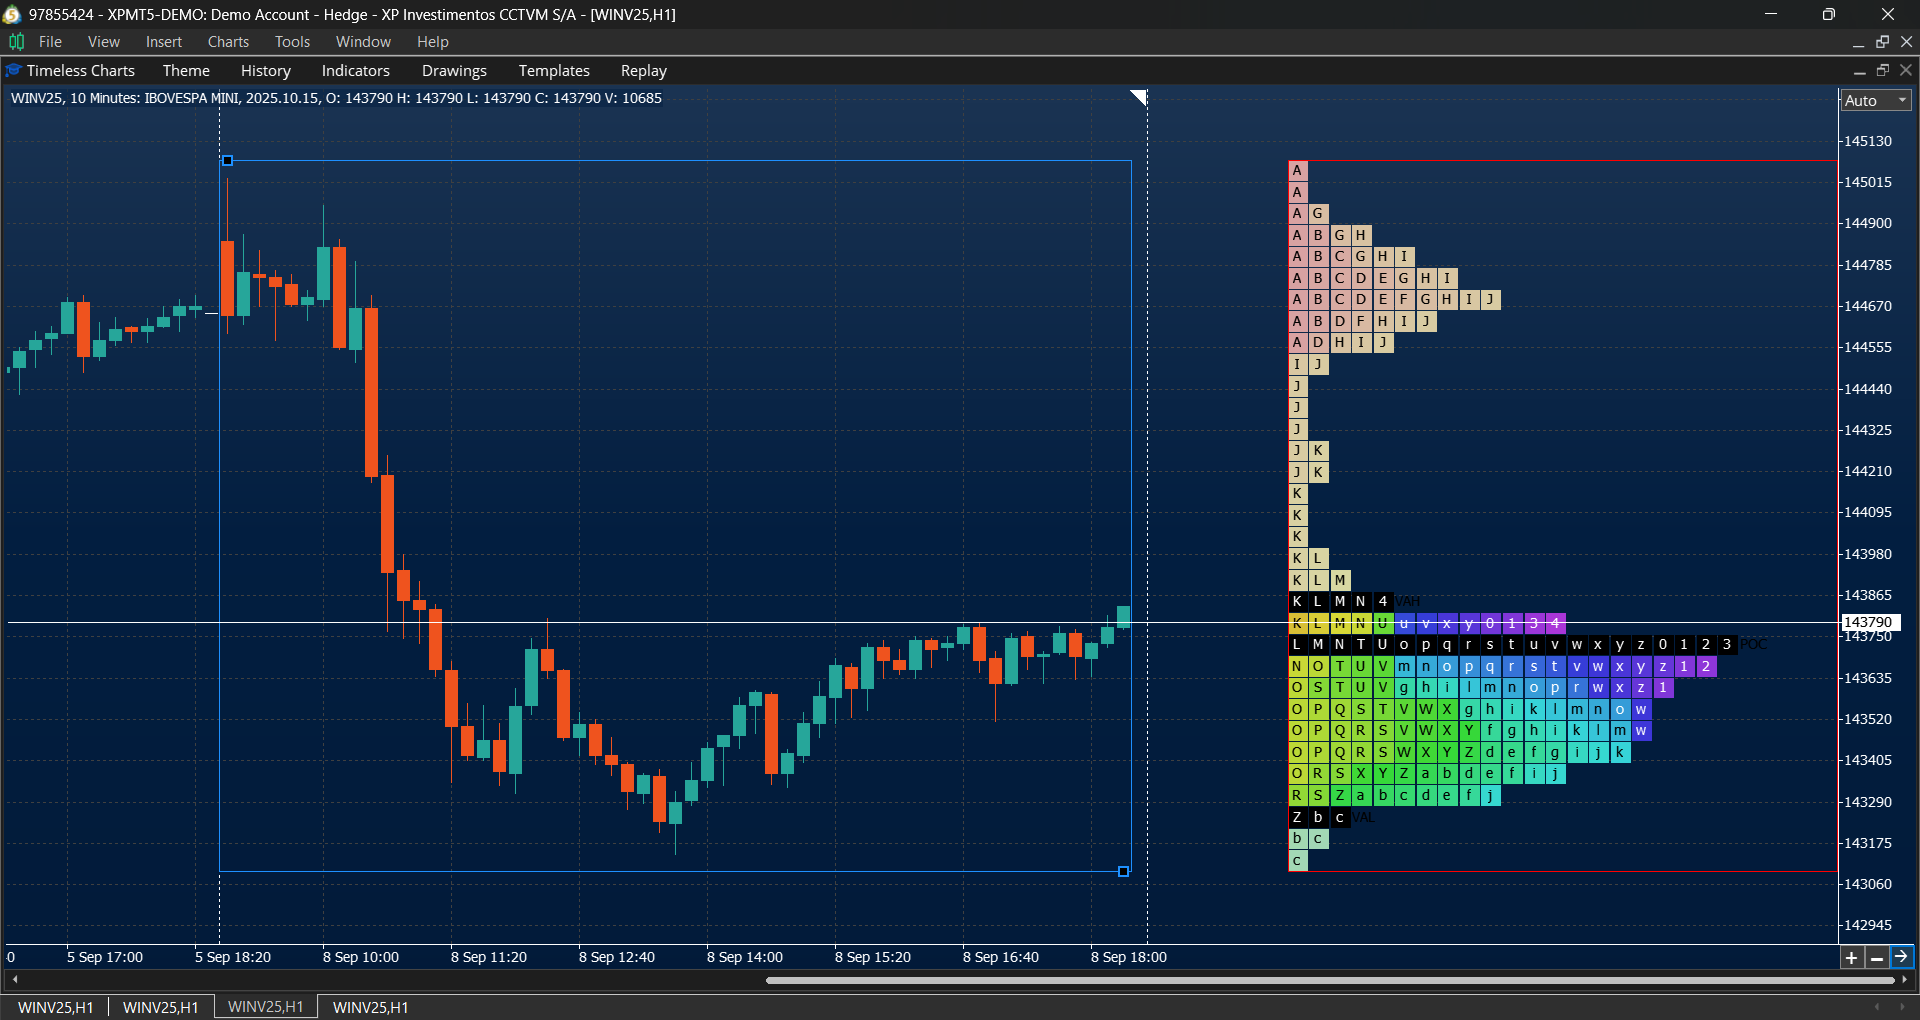
Volume Profile, TPO Market Profile and VWAP
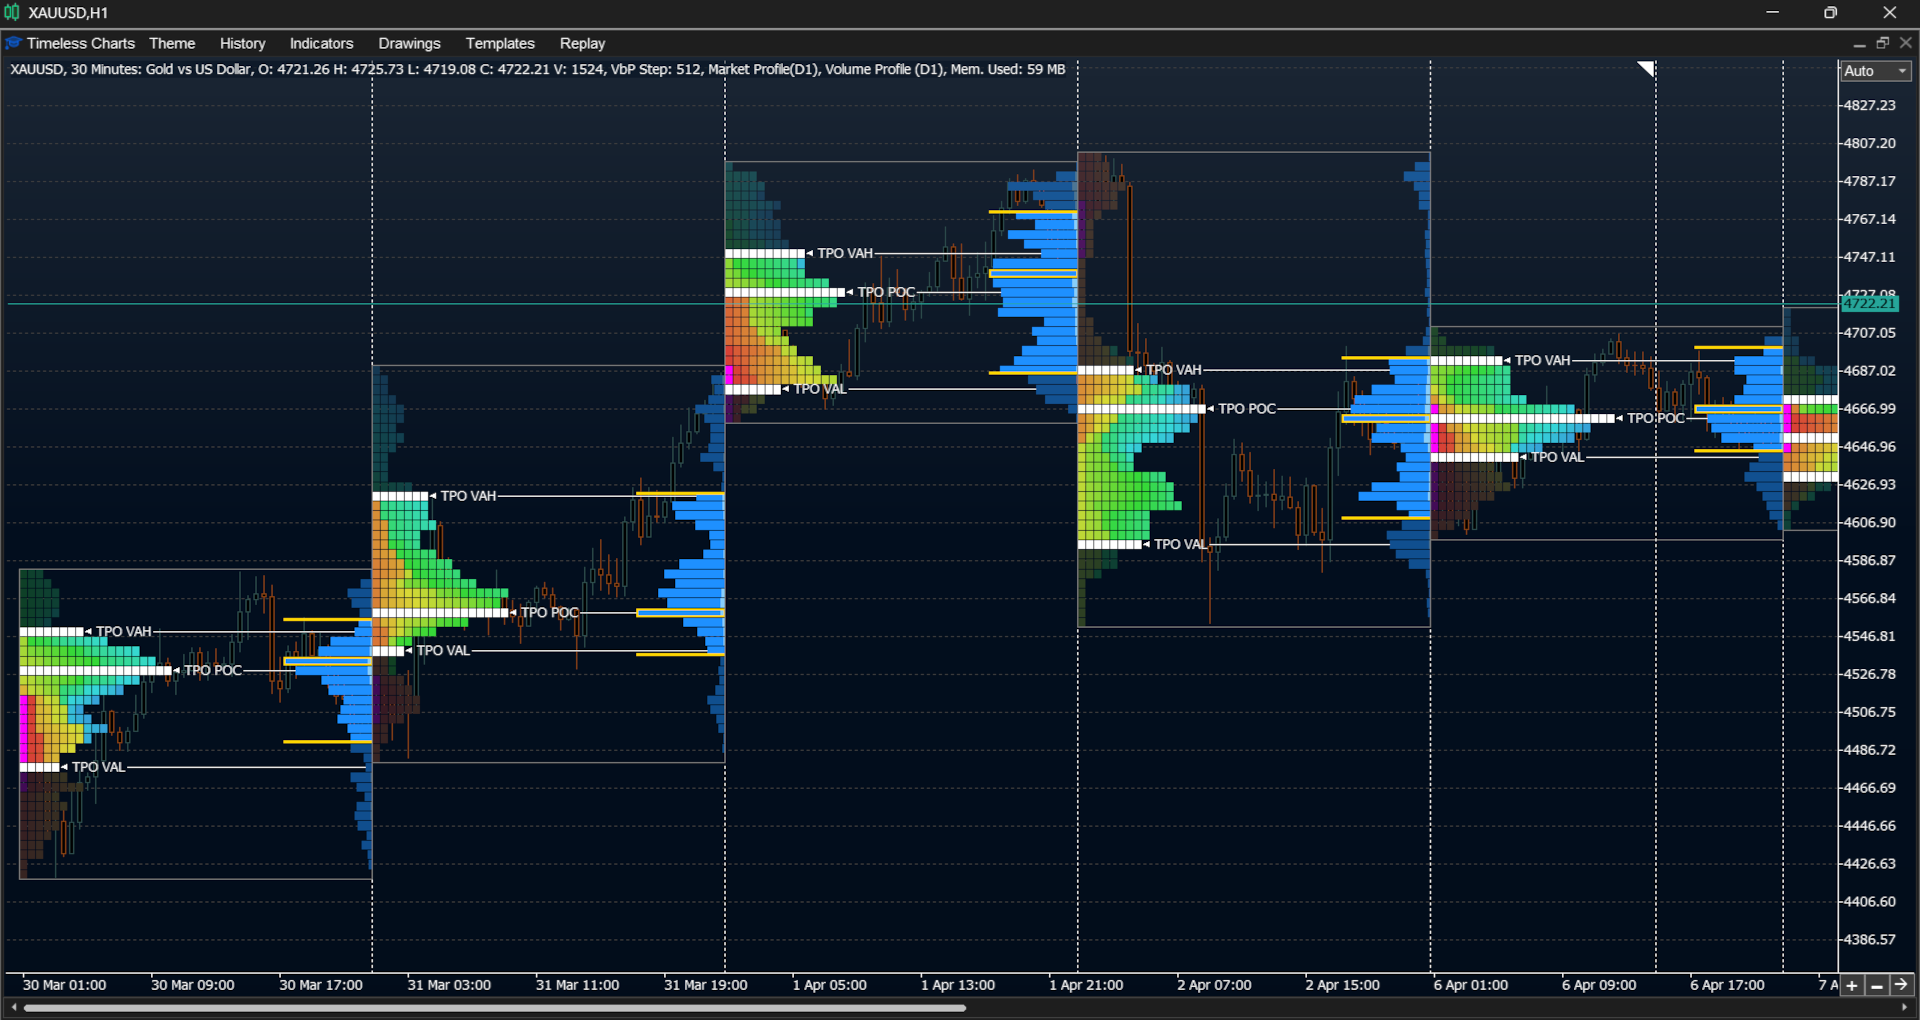
Analyze market structure and auction dynamics using Volume Profiles, TPO Market Profiles, VWAP studies, and anchored variations designed to provide market context across sessions, trends, and significant price events.
- Volume Profiles and Anchored Volume Profiles for identifying Value Areas, Point of Control (POC), and volume distribution.
- TPO Market Profiles and Anchored TPO Market Profiles for analyzing auction market structure and market development.
- VWAP Bands and Anchored VWAP Bands for analyzing price acceptance, rejection, balance, and expansion.
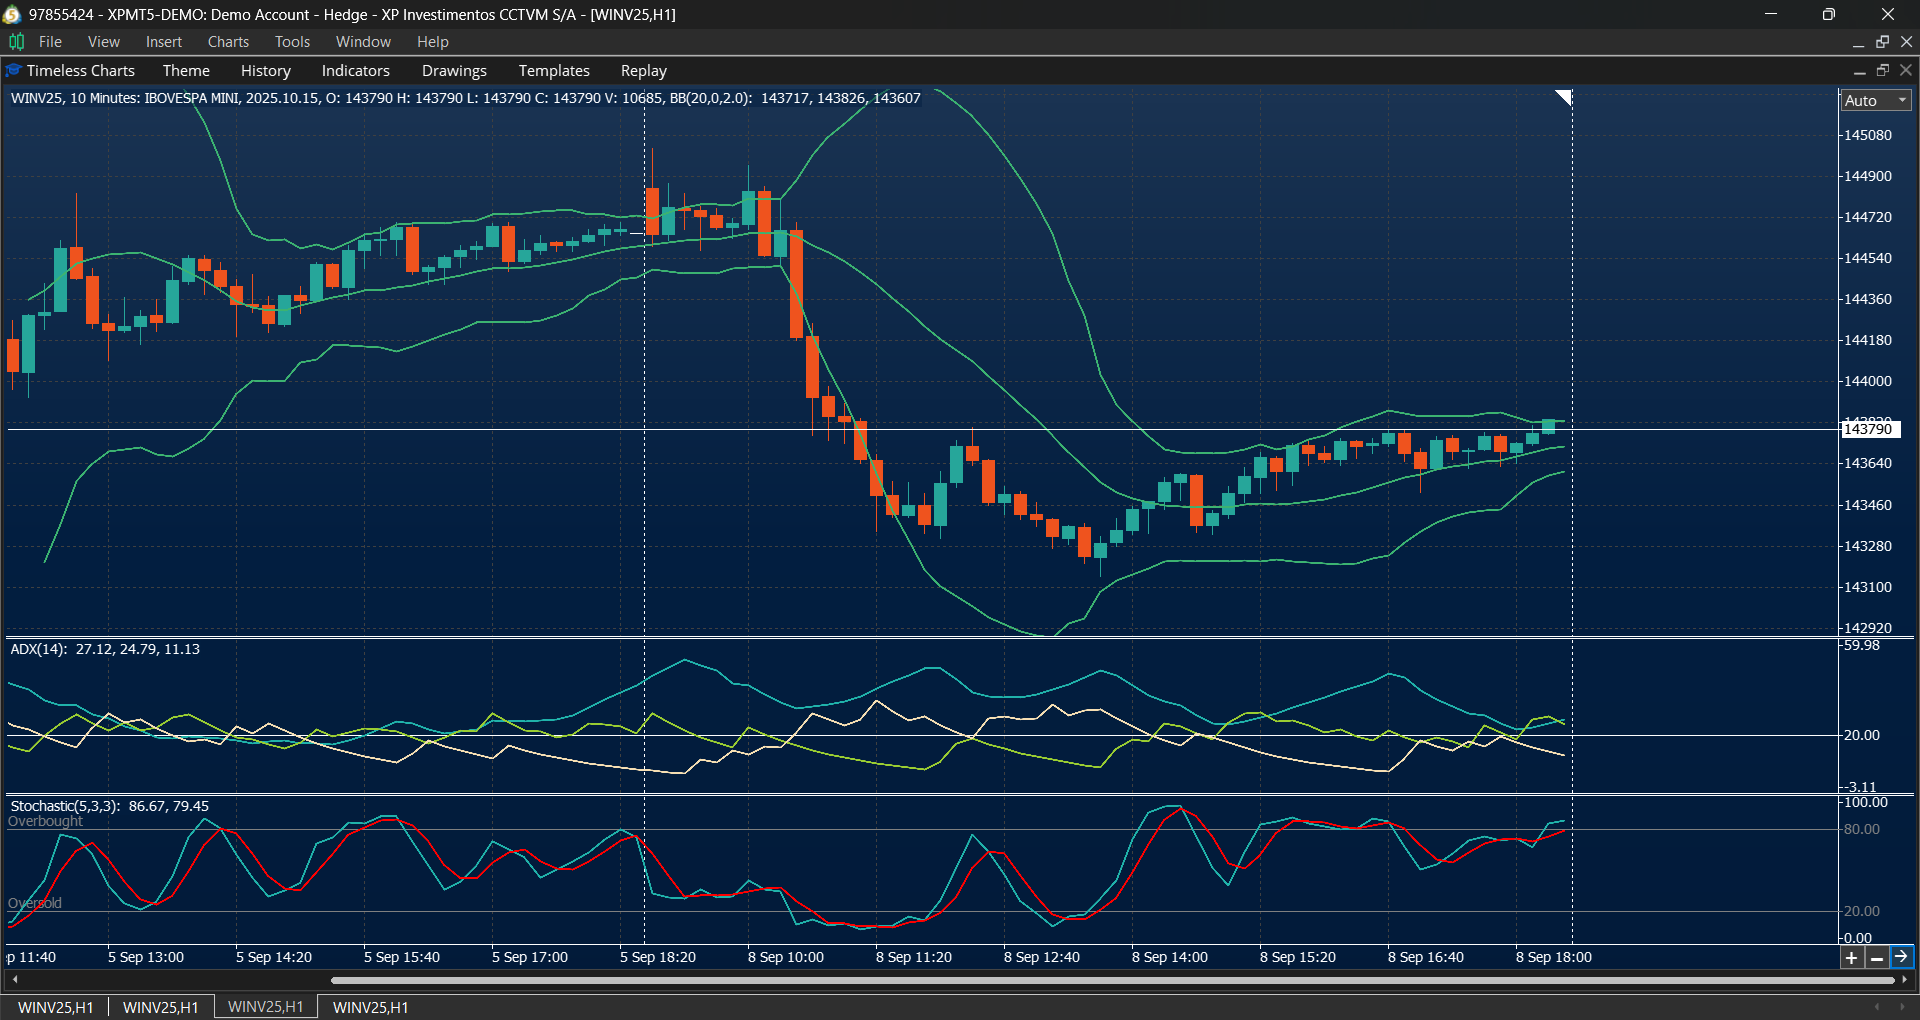
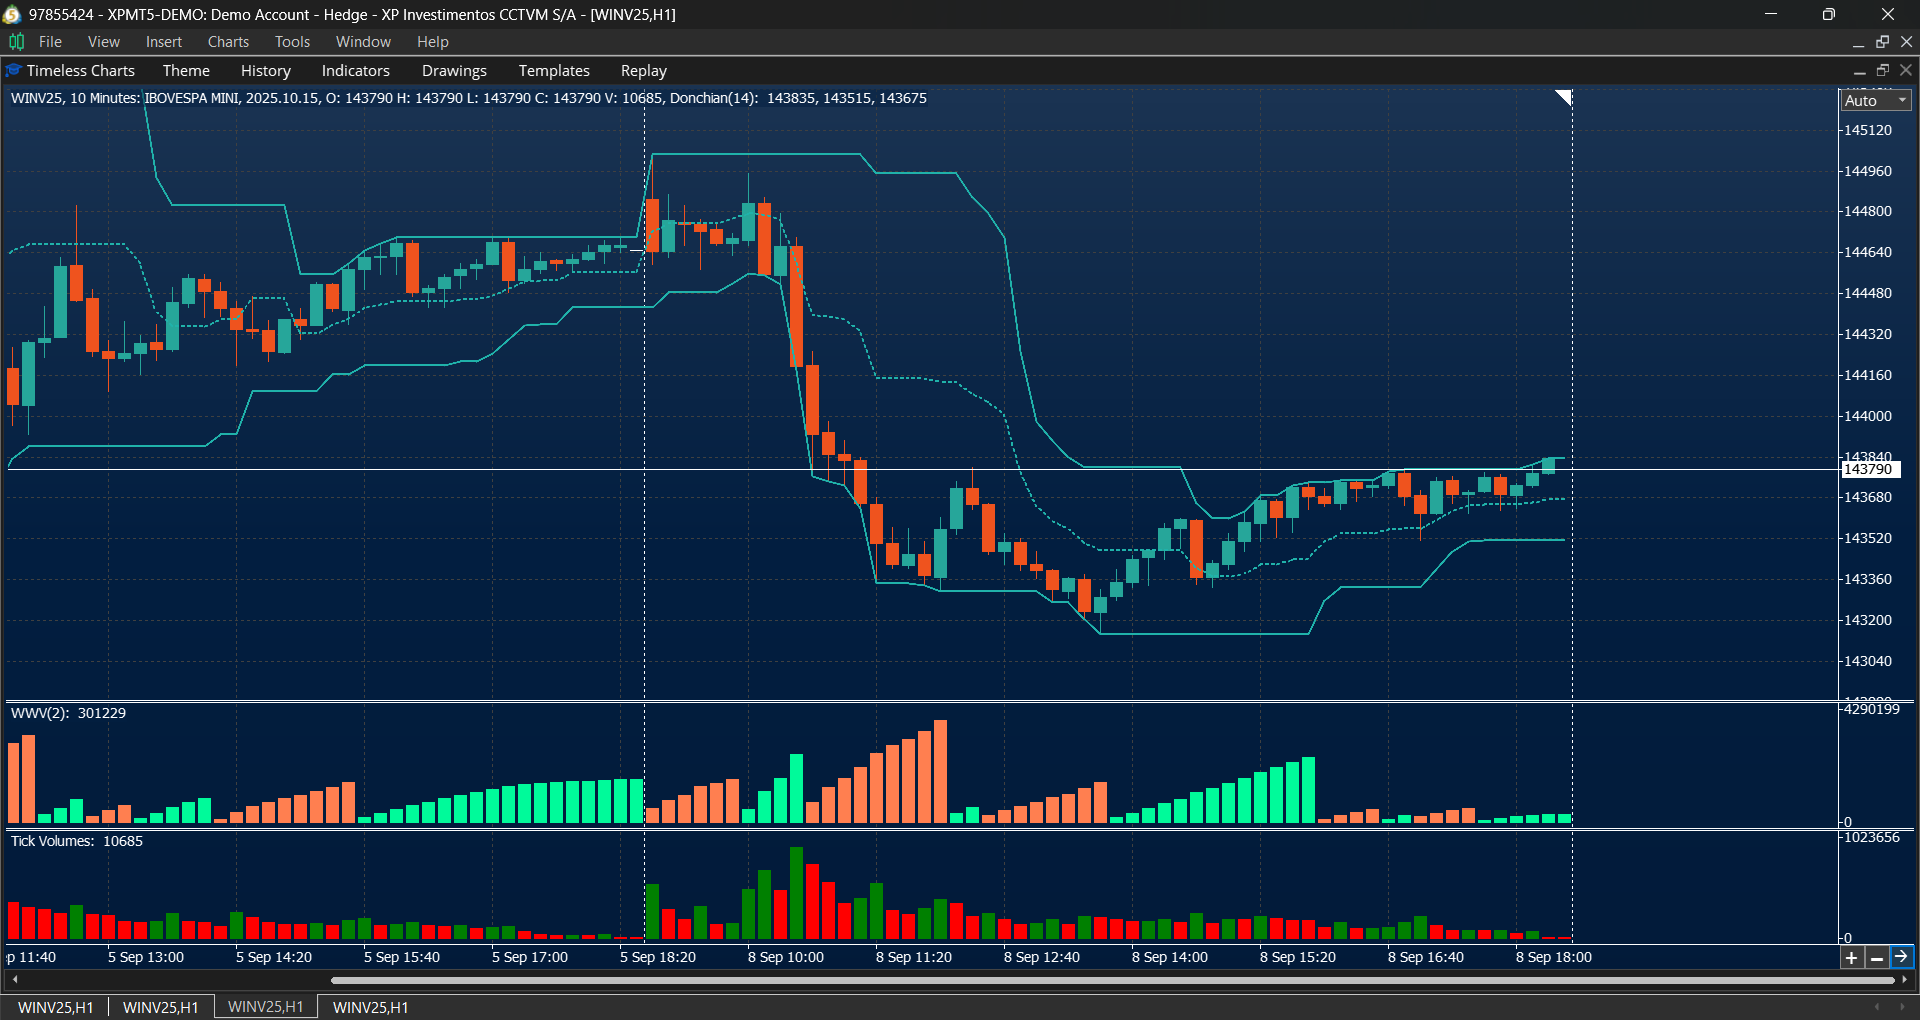
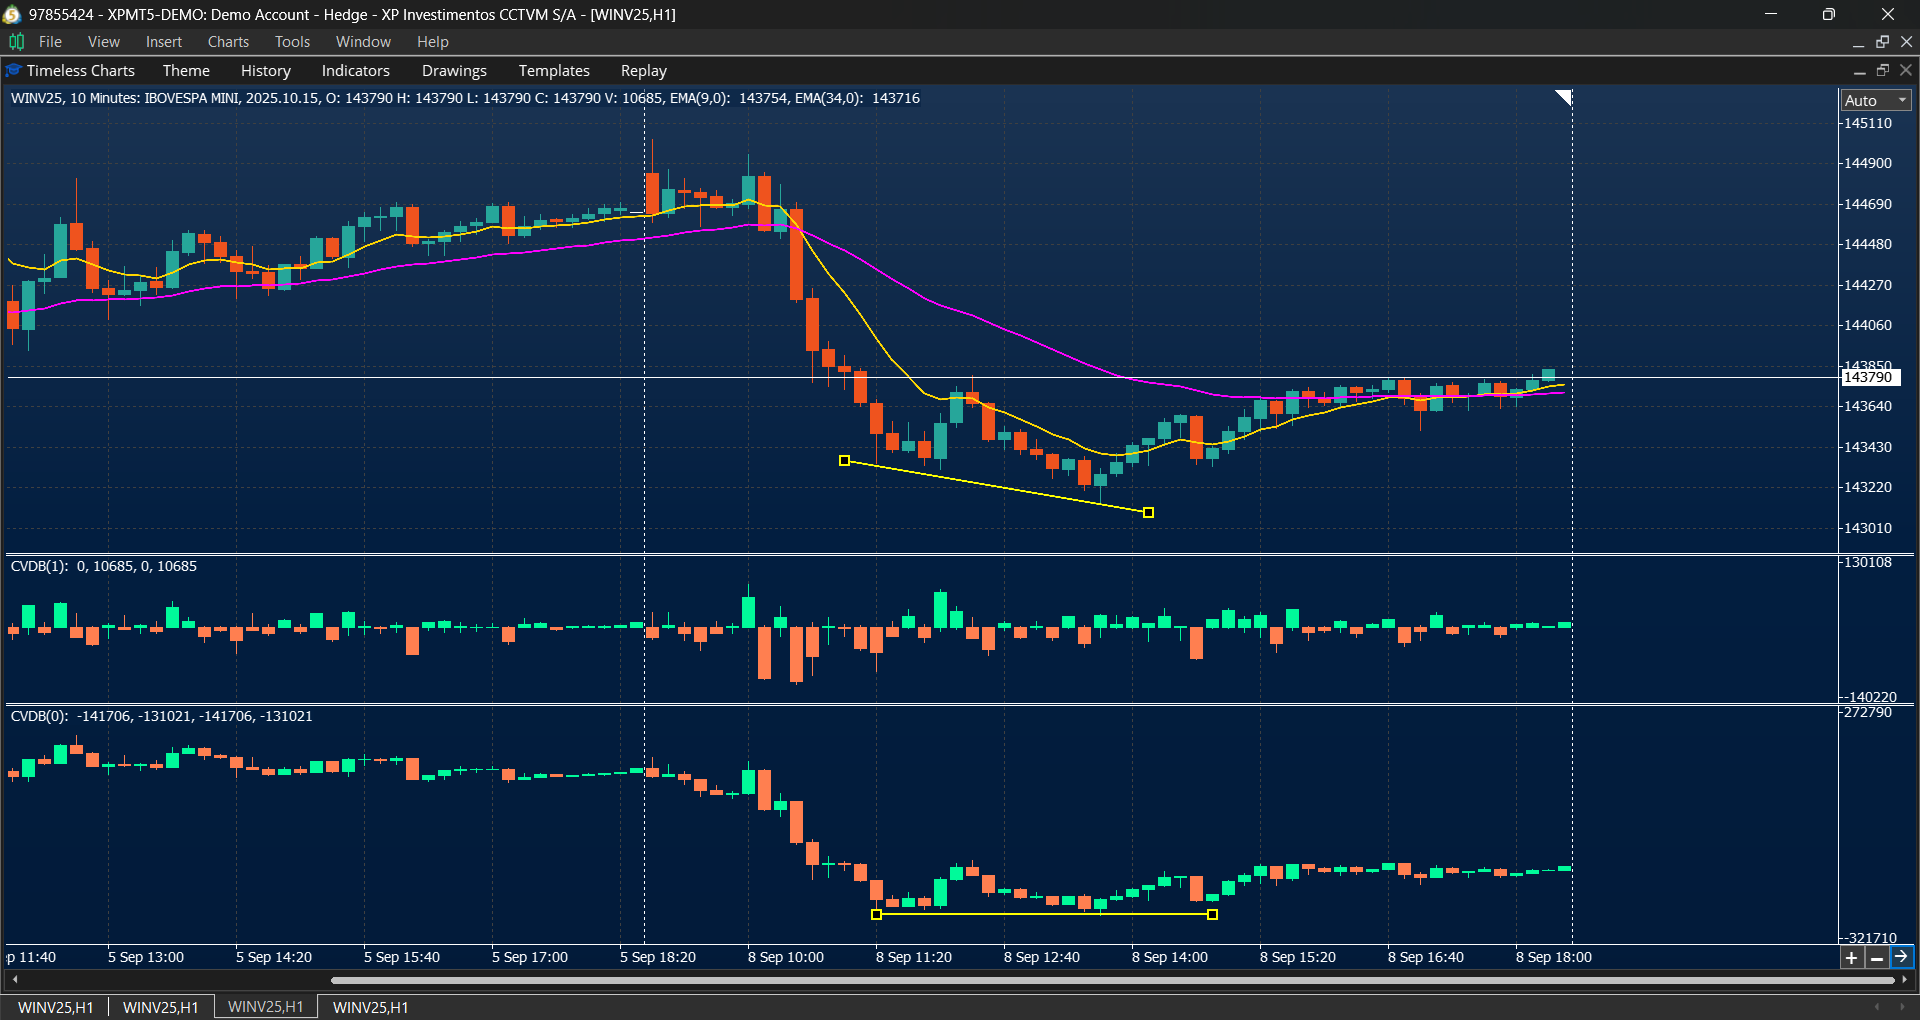
Indicators and Market Studies
Timeless Charts integrates technical indicators and market studies to support both traditional analysis and order‑flow based approaches:
- Technical indicators such as RSI, Stochastic, Moving Averages, Bollinger Bands, MACD, and others for analyzing trend, momentum, and volatility.
- Volume and Delta studies including Weis Wave, Cumulative Delta, and Volume Profiles to measure buying and selling pressure, liquidity shifts, and intraday participation.
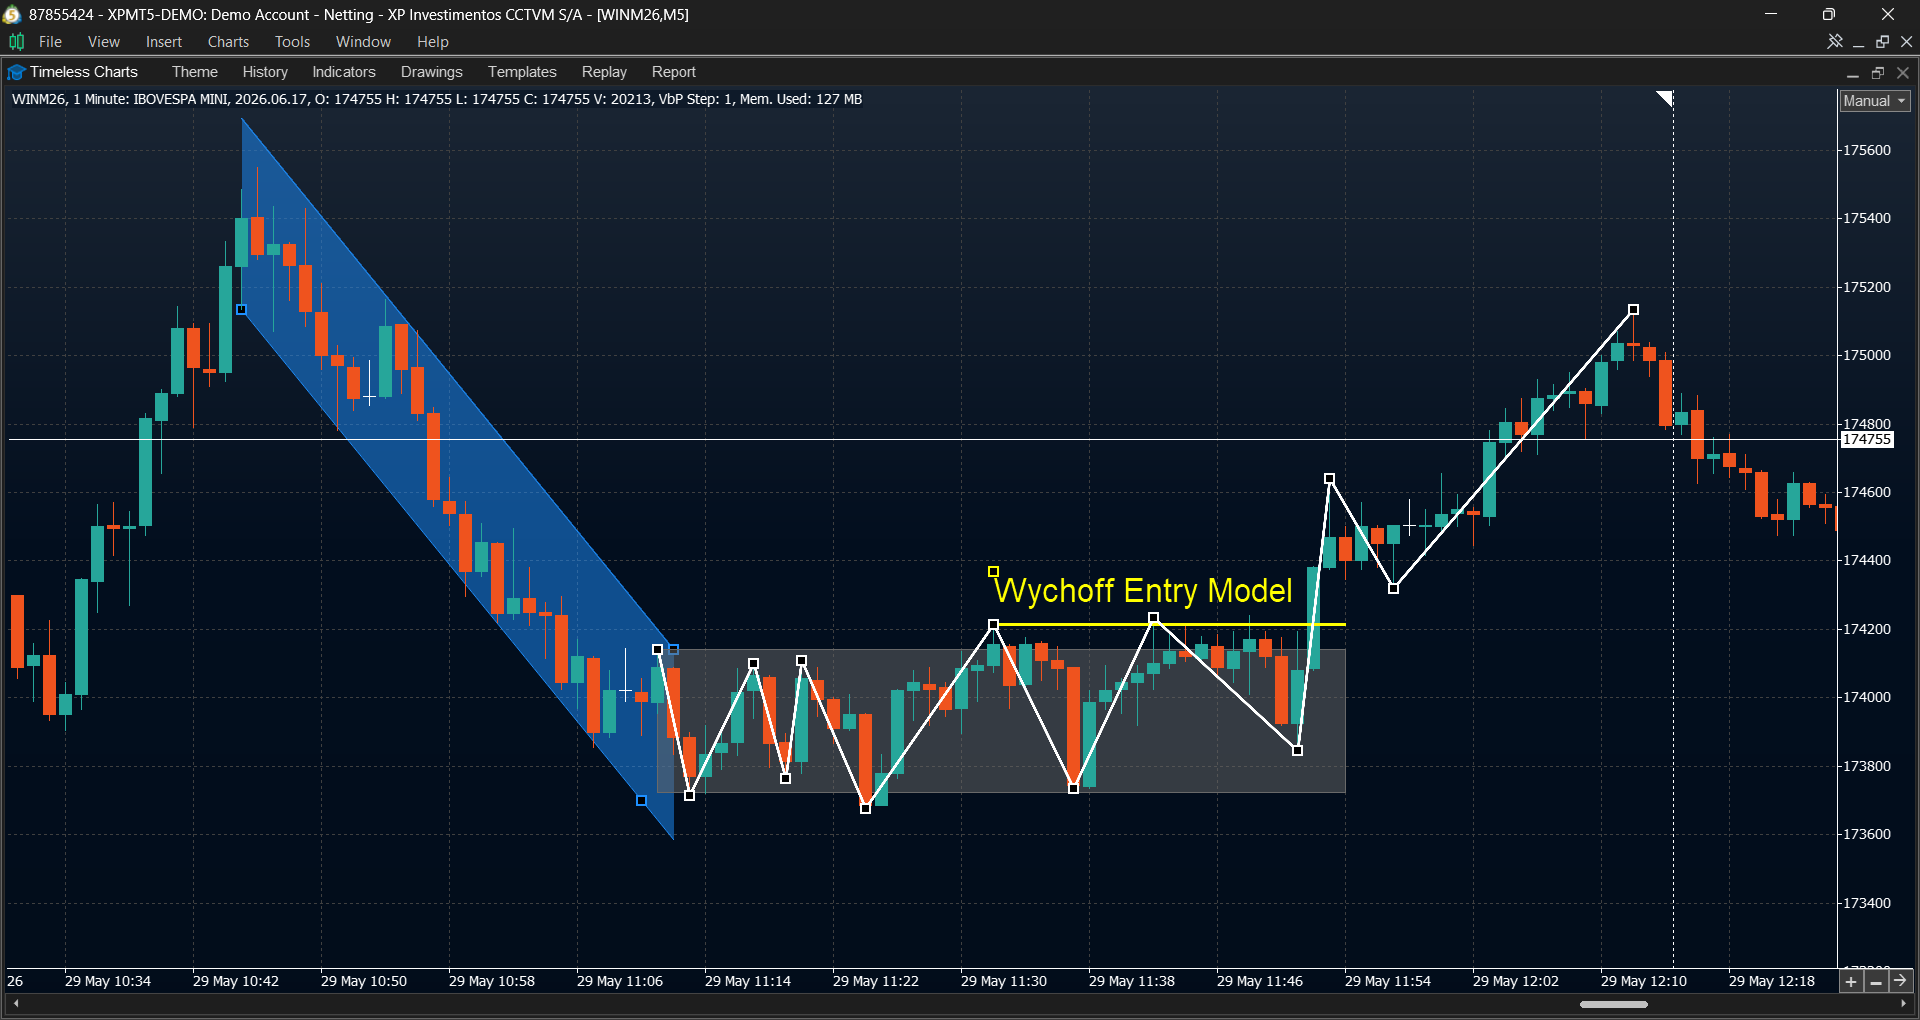
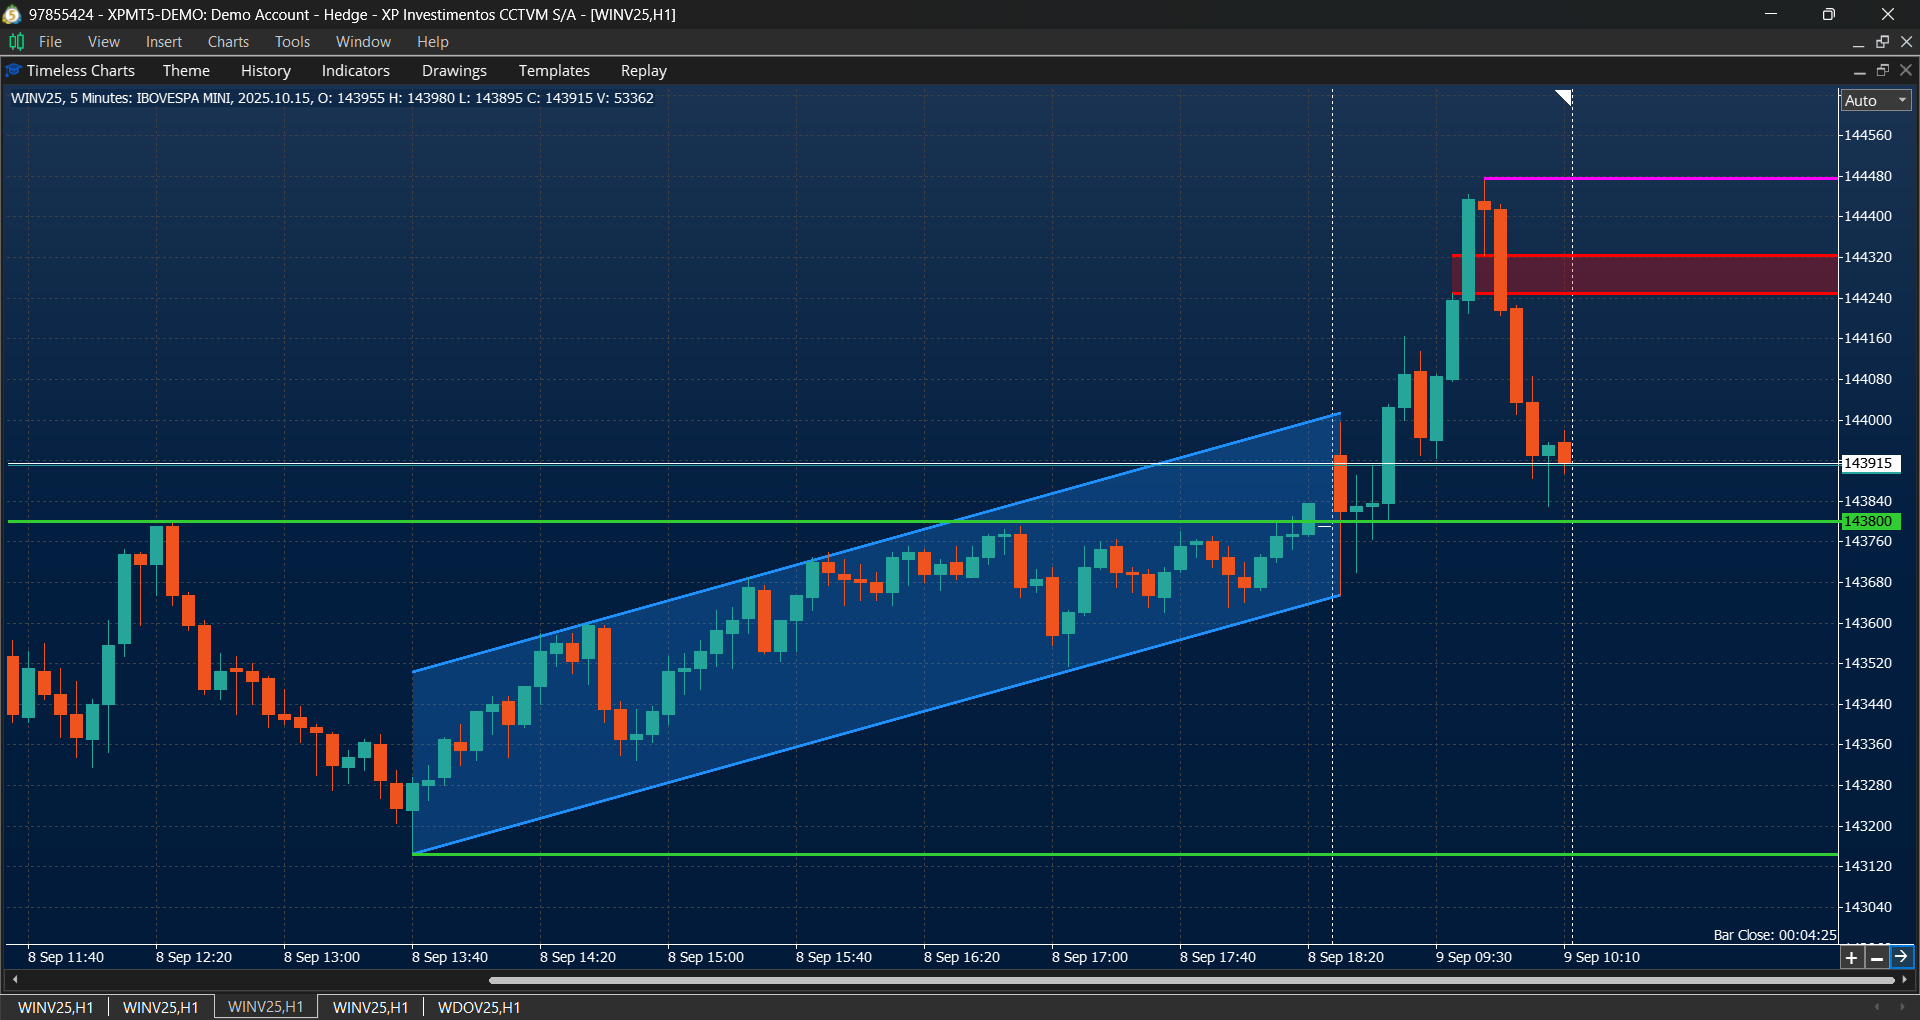
Drawing and Charting Tools
A complete set of analytical and annotation tools, with synchronization across charts of the same instrument:
- Text and labels for annotations and marking key events.
- Lines and shapes including horizontal and vertical lines, trend lines, triangles, and rectangles.
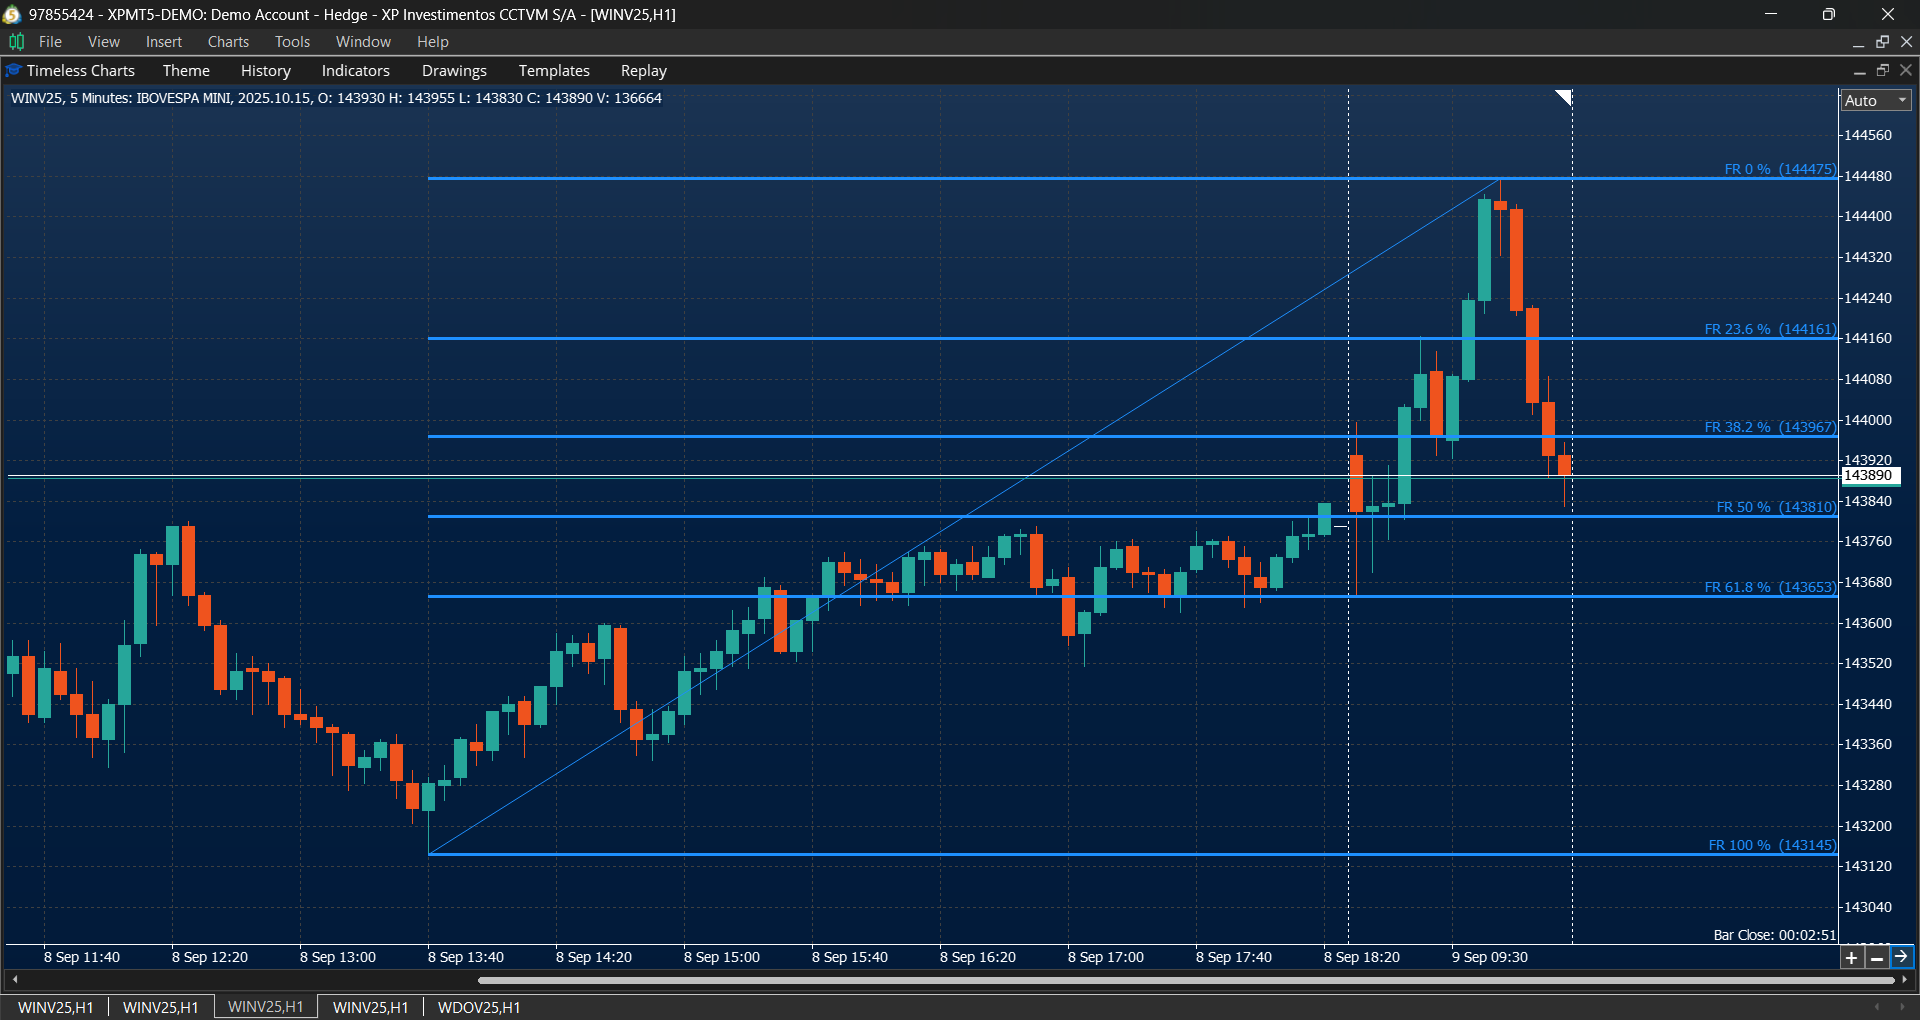
- Fibonacci tools such as retracement and expansion, Fibonacci channels, and equidistant channels.
- Statistical channels including linear regression and standard deviation channels.
- Anchored analysis tools such as Anchored VWAP, Anchored Volume Profile, and Anchored TPO Market Profile.
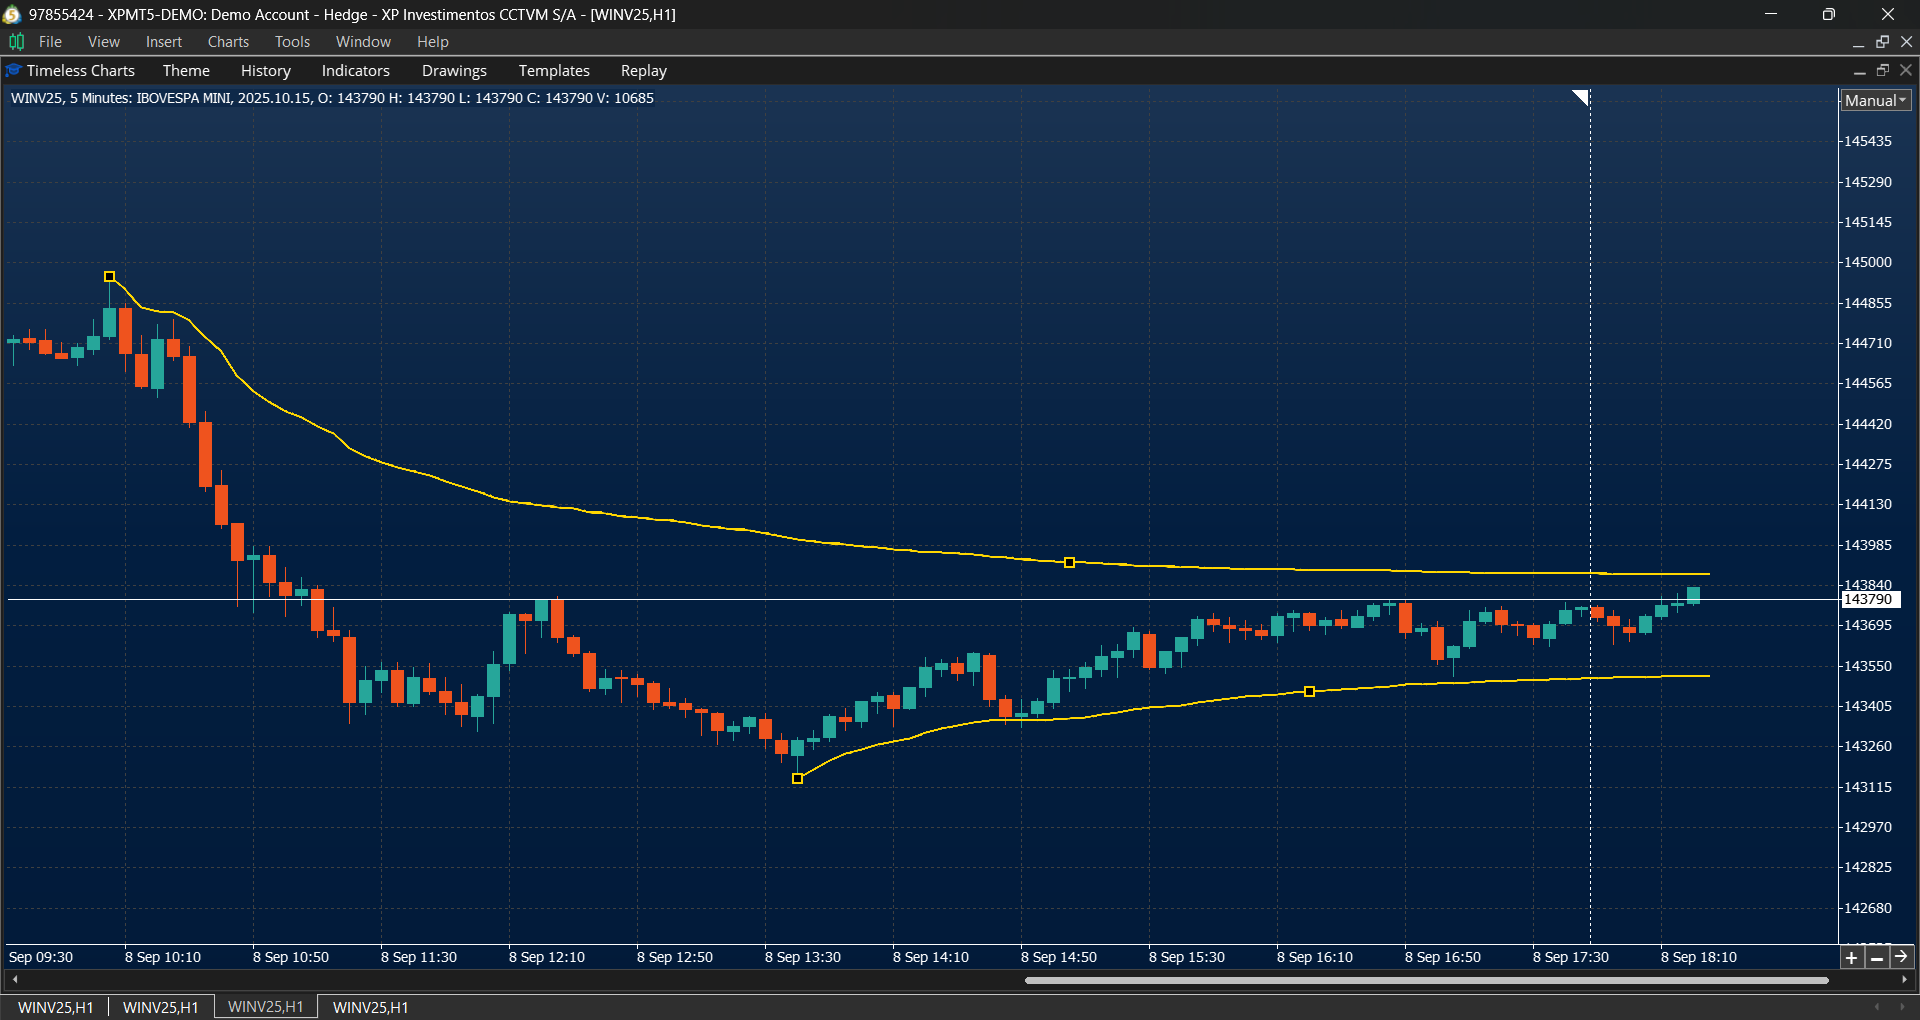
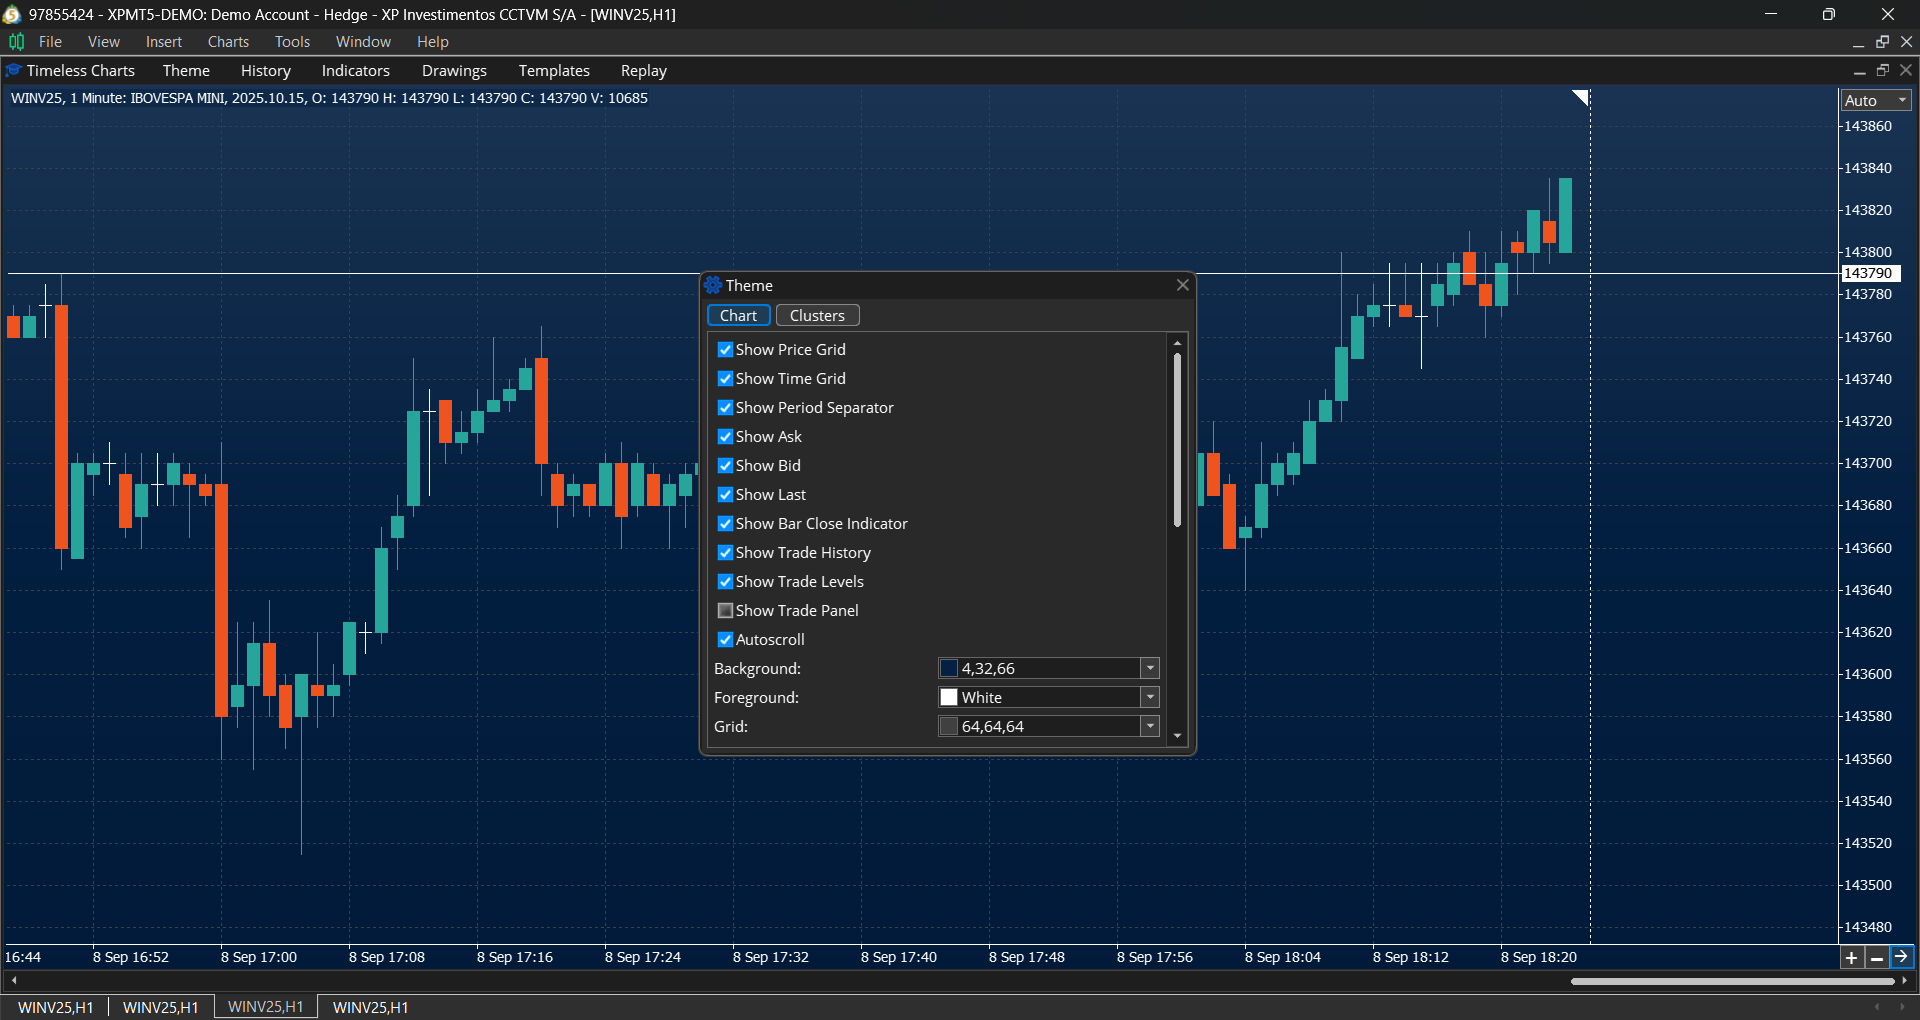
Additional Chart Features
Timeless Charts provides extra tools that make market analysis clearer and more practical. Key features include:
- Global crosshair, which synchronizes multiple charts and timeframes of the same instrument, making it easier to compare different periods and align analysis.
- Global drawings, which allow annotations and technical studies to be synchronized across charts of the same instrument, ensuring consistency when analyzing multiple timeframes.
- Price‑centered scale, which keeps the current price near the center of the chart while it fluctuates within configurable margins. This is especially useful in Footprint Charts and order‑flow studies, where a stable visual reference is critical for interpreting market dynamics.
- Other options such as a candle clock (close timer), independent price and time grids, and flexible scaling modes (automatic or manual), extending the standard charting capabilities of MetaTrader 5.
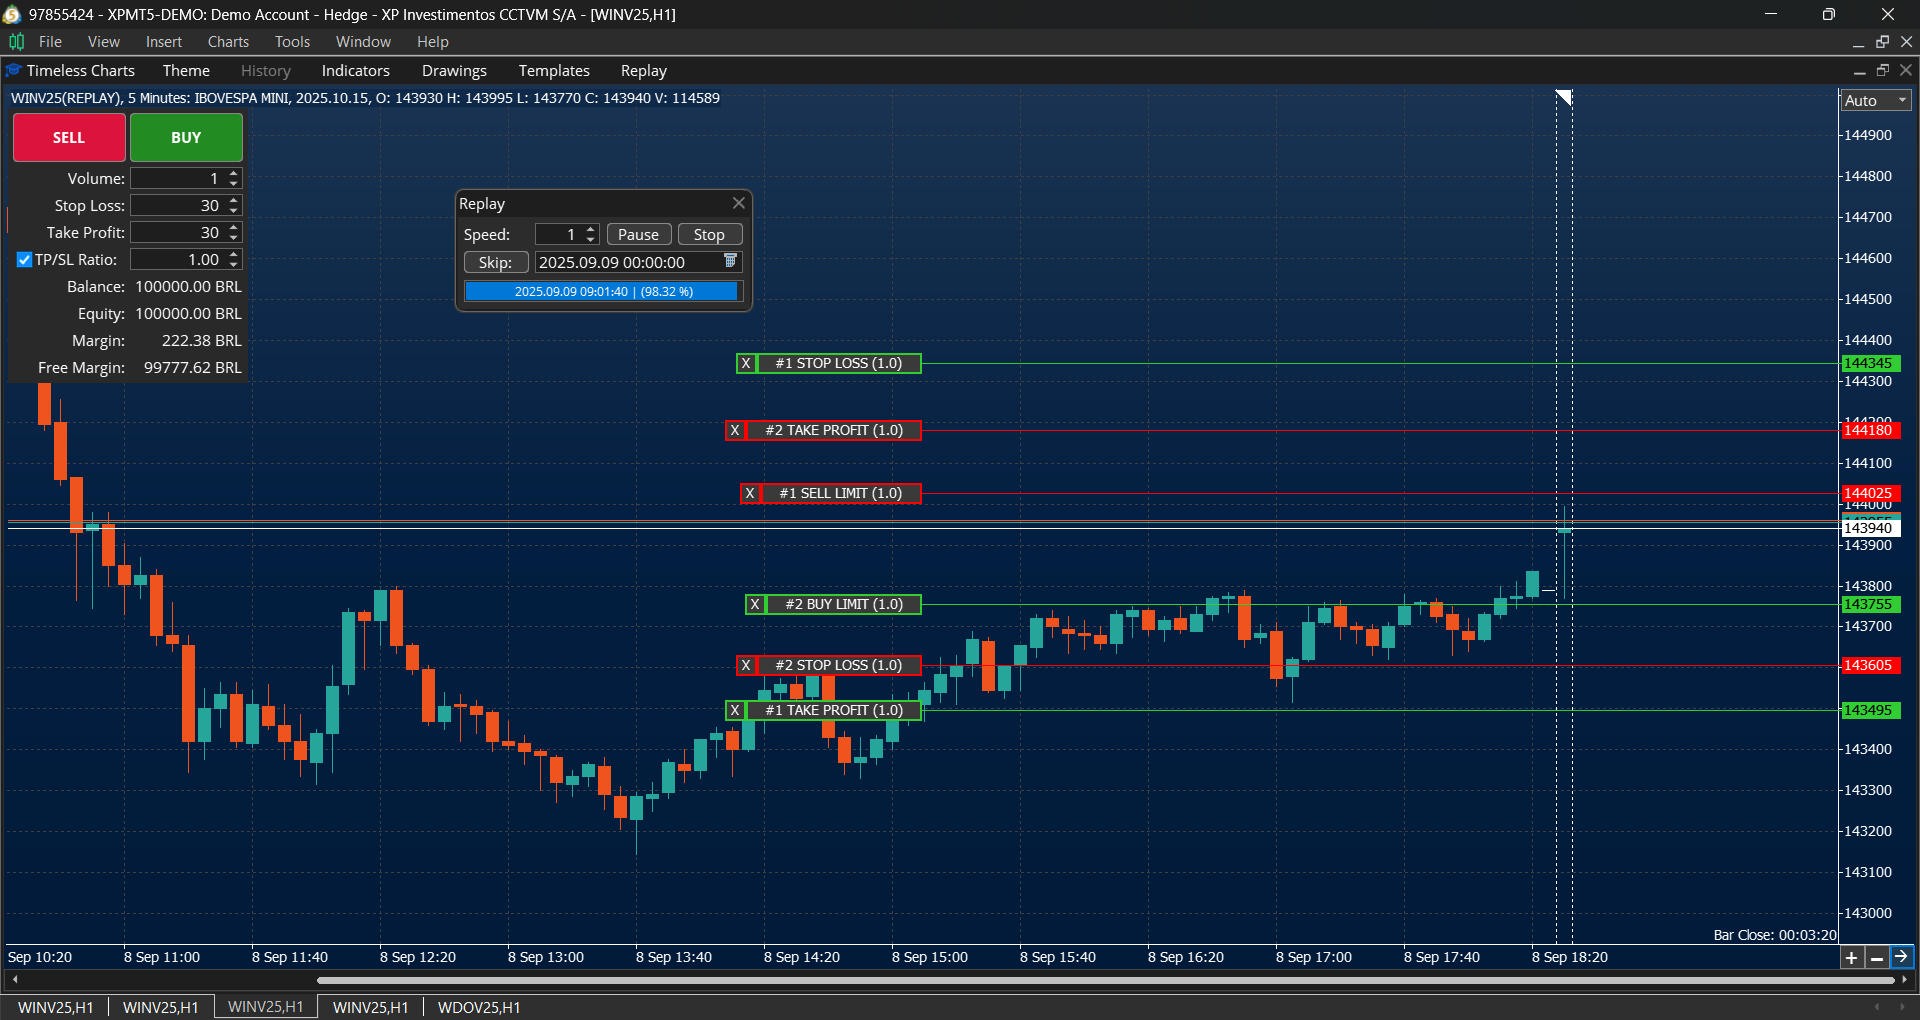
Trading Features
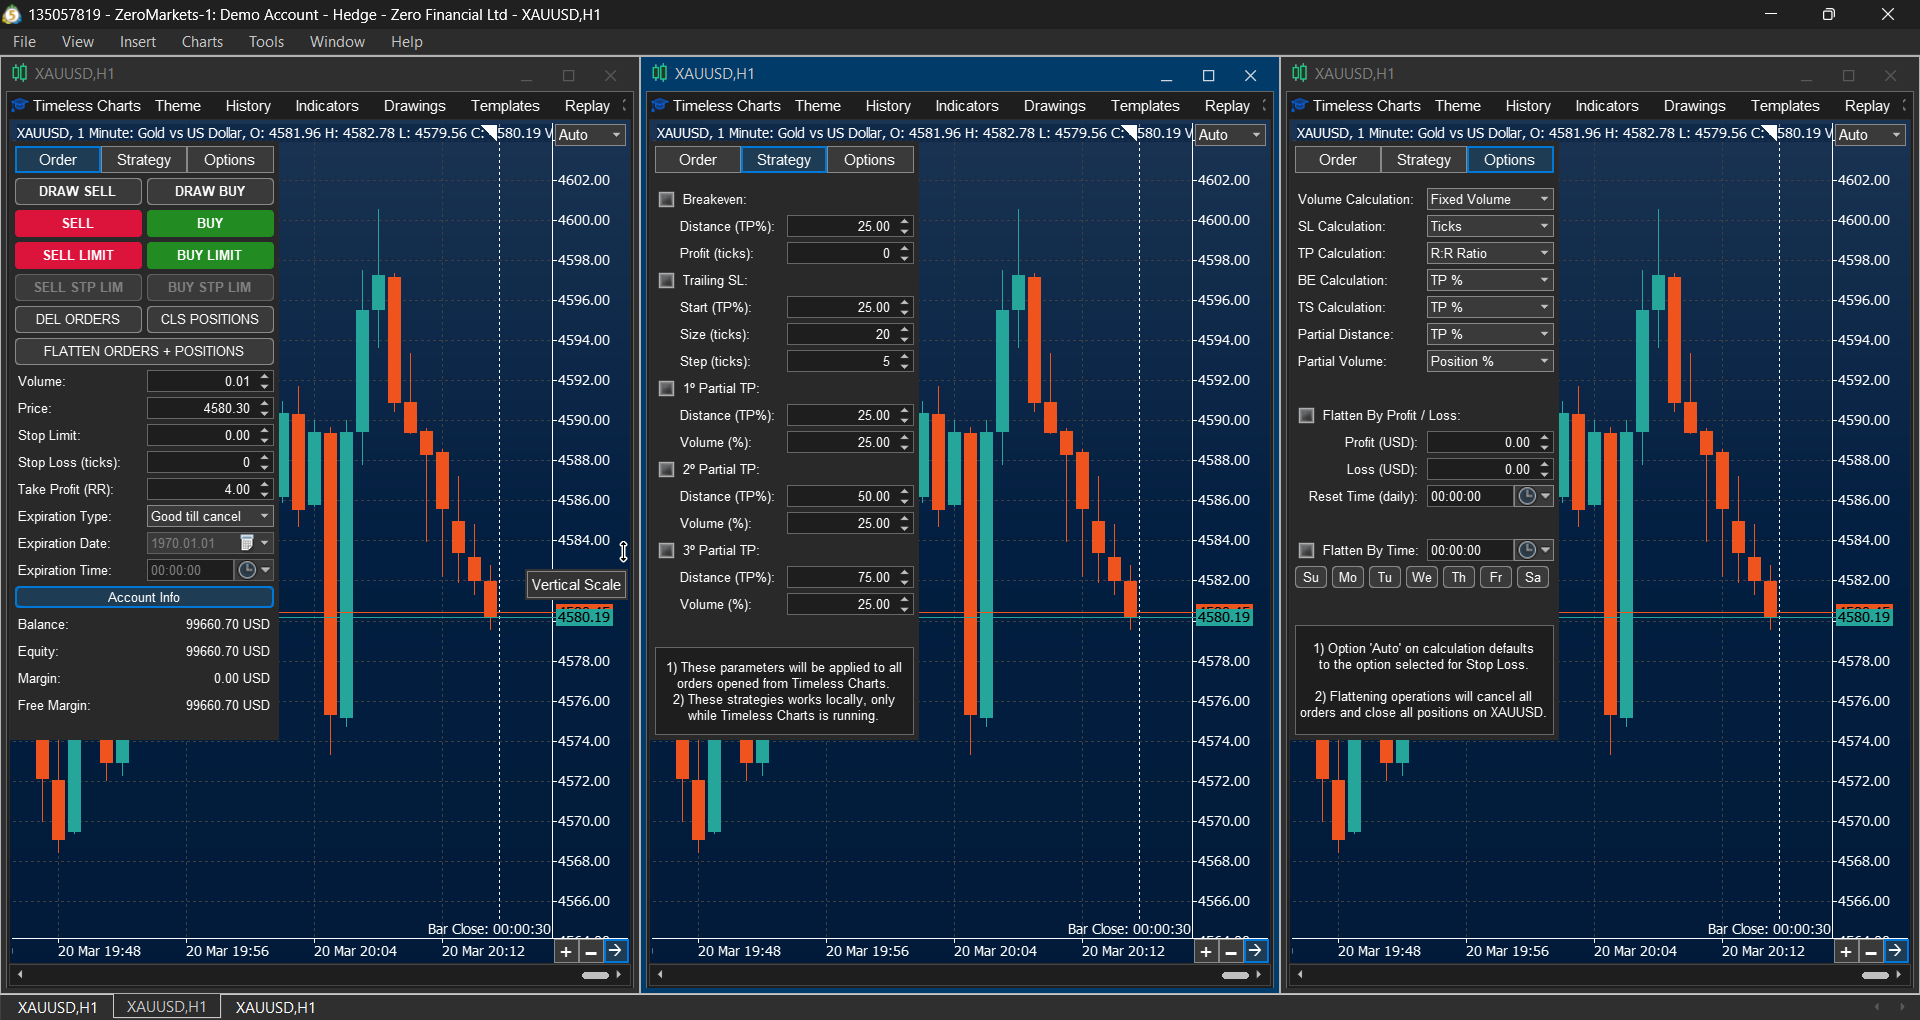
Timeless Charts includes its own integrated trading panel, designed specifically for custom chart interfaces where third‑party assistants from the MQL5 Market may not work as expected. This panel provides advanced order and position management directly within the chart:
- Two‑Step Order Placement: press CTRL or SHIFT to preview the order at the cursor position on the chart, then confirm with a left mouse click.
- Pre‑configured actions such as automatic partial take profits, breakeven adjustments, and trailing stops, set before order placement.
- Flexible trigger levels that can be adjusted either in the trading panel or by dragging levels directly on the chart.
- Automatic flattening of orders and positions based on profit targets, loss limits, or scheduled rules (day of week and time).
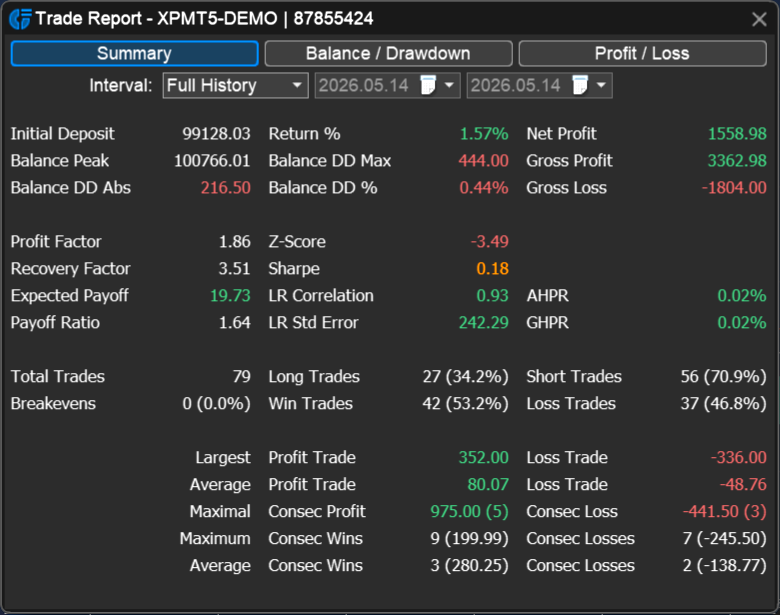
Reports and Statistics
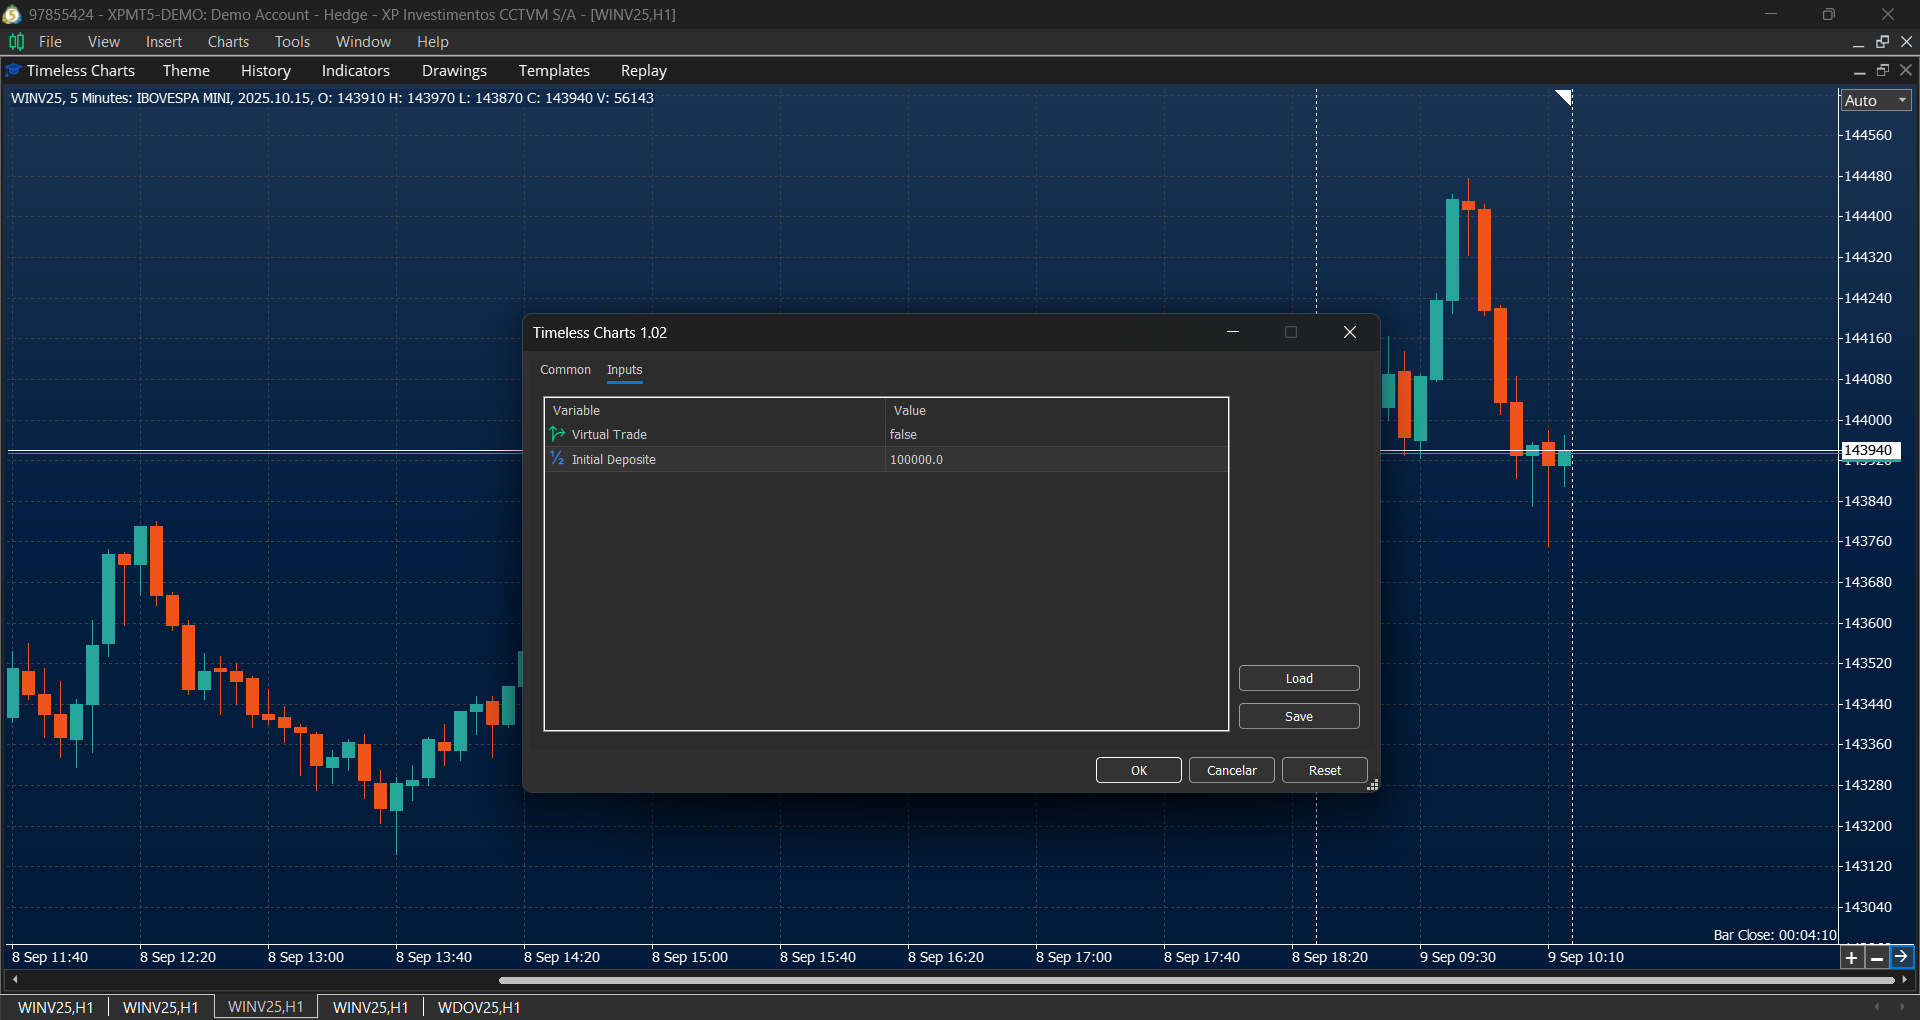
Measure trading performance using detailed analytics for profitability, win rate, expectancy, drawdowns, risk‑reward ratios, and other key metrics. Reports are available for real accounts, demo accounts, virtual accounts (realtime simulation), and market replay sessions. Apply date and symbol filters to identify strengths, weaknesses, and opportunities for improvement.
- Summary tab with performance statistics in text/table format.
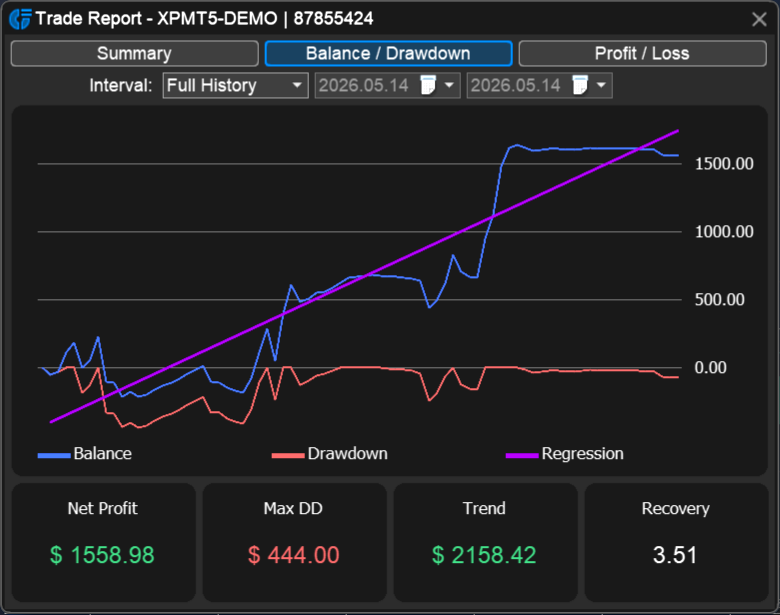
- Balance vs Drawdown graph to visualize account growth and risk.
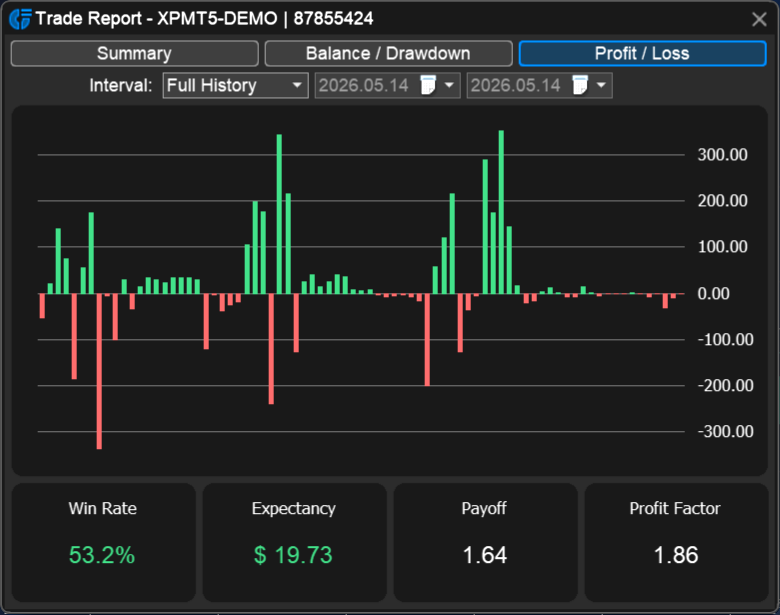
- Profit/Loss graph displayed as bars/histogram for trade results.